Download
1 / 22
220 likes | 360 Views
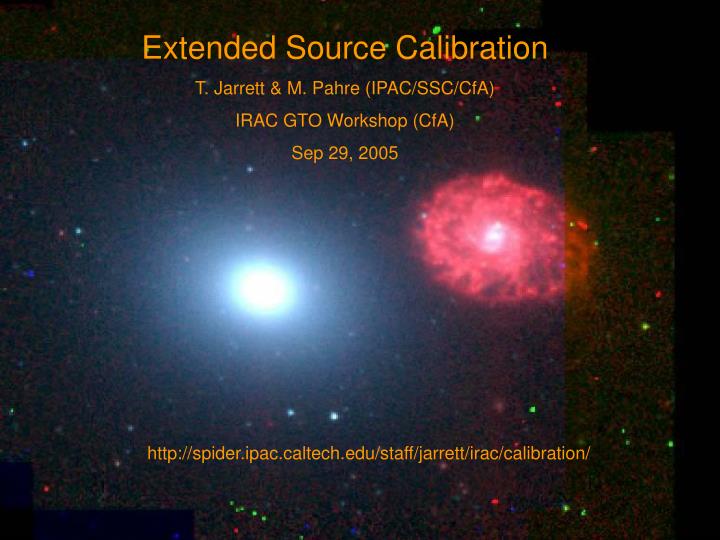
Extended Source Calibration T. Jarrett & M. Pahre (IPAC/SSC/CfA) IRAC GTO Workshop (CfA) Sep 29, 2005. http://spider.ipac.caltech.edu/staff/jarrett/irac/calibration/. Contents. Background (history) Method Sample Models Results Discussion. Background. Hora et al 2004. Curve of growth

E N D
Extended Source Calibration T. Jarrett & M. Pahre (IPAC/SSC/CfA) IRAC GTO Workshop (CfA) Sep 29, 2005 http://spider.ipac.caltech.edu/staff/jarrett/irac/calibration/ Jarrett 2005
Contents • Background (history) • Method • Sample • Models • Results • Discussion Jarrett 2005
Background Hora et al 2004 Jarrett 2005
Curve of growth Blue = 3.6 m Green = 4.5 m Yellow = 5.8 m Red = 8 m Jarrett 2005
Pahre’s table (Hora et al 2004) NGC 777 Jarrett 2005
Method Compare photometry of E galaxies with predicted SEDs • Sample of dust-free E’s that range from 10 arcsec to 5 arcmin • NIR & MIR observations • E-galaxy SED template(s) • 2MASS & IRAC bandpass convolved with SEDs • remove foreground stars & neighbor galaxies • integrate light in a nested set of apertures • Normalize SEDs with NIR • Compare with models Jarrett 2005
Complications …. • background gradient (Zodi, bright stars, stray light) • foreground star subtraction • neighbors (extended emission) • inadequate coverage (largest galaxies) • which model to use? • dust? (e.g., NGC4552) Jarrett 2005
Sample Criteria: E/S0 little or no IRAS emission minimal ‘complexities’ N1404 & N4552 are from SINGS ESO507 & N5044 from IST “special cal” observations N6703, N777, N5846, N4649, N4472 from IRAC GTO galaxy survey
Models • GRASIL • Bruzual & Charlot (T=11 Gyr (original single burst), low metallicity galaxy) • K2III spectrum + model (Cohen) GRASIL (GRAphite and SILicate) code from Silva et al. 1998. GRASIL generates galaxy SEDs from optical to far-infrared (FIR) wavelengths by computing the spectral evolution of stellar systems and taking into account the effects of dust in a variety of geometries. For this study, we use the “old galaxy” (t = 13 Gyrs) template (one of the templates used by SWIRE). Jarrett 2005
With H-band normalization of the GRASIL template … Jarrett 2005
Results NGC777 Jarrett 2005
max or optimum radius Jarrett 2005
Discussion • Huge scatter in the radius vs. flux correction relation. This underscores the large uncertainties in relating the IRAC measurements to that of a model galaxy. Also, for the largest galaxies, the background subtraction is absolutely crucial toward accurate photometry -- and this is no easy feat. • Small dependence on the 3.5 and 4.5 micron flux ratios with size of galaxy. The correction is about 5 to 9% for 4.5 microns, and 12 - 15% for 3.5 microns. This correction may be due to an incorrect zero point in the point source flux calibration (tending to over-estimate extended sources). • Clear dependence of the flux ratio with size for the Si:As bands, ranging from 25 to 30% for 5.8 microns and 20 to 25% for 8.0 microns. We expect to see a dependence with radius (i.e., the smaller the galaxy, the flux ratio should approach unity or the point source calibration value). • In principle, the dotted lines (MRK 231) on the left side of the results plot should connect smoothly with the dashed lines (galaxy photometry vs. model SEDs) on the right. This only happens for IRAC-2. Either (1) the SED models are not adequate in describing the light distribution of the E galaxies, or (2) the situation is more complex -- that is, the point source scattering of light (MRK 231) is not the same as the extended source scattering case. • A sample of small E galaxies is needed, spanning a size range from 10 to 30 arcsec.