Download
1 / 15
160 likes | 392 Views
Types of variables, treatment of missing data. 20.10. 2009. Types of variables (number of values). continuous variables (any value within a range) discrete variables (finite number of values) some discrete variables can be treated as continuous (counts). Types of variables (measurment).

E N D
Types of variables, treatment of missing data 20.10. 2009
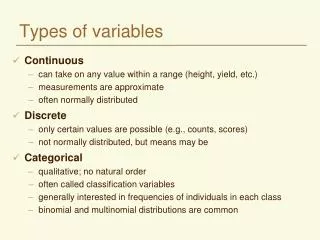
Types of variables (number of values) • continuous variables (any value within a range) • discrete variables (finite number of values) • some discrete variables can be treated as continuous (counts)
Types of variables (measurment) data$country<-as. factor(data$country) data$qf1<-as.ordered(data$qf1) data$vd8<-as.numeric (data$vd8) • Data type definition can be • usefull = some of the procedures work differently for different types of the data • an obstacle (sometimes you want to do something that is, strictly speaking, not allowed
Missing data What is the nature of missing data? How can we deal with misssing data depends of their mechanism, i.e. mechanism that produced them... No easy answers... All decisions about how to deal with missing data have impacts the results...
Types of missing data Missing completely at random (MCAR) probability that an observation Xi is missing is unrelated to the value of Xor any other veriable weather conditions, failure of measuring equipment etc. Missing at random (MAR) probability of missing value does not depend on the value of X after controling for another variable e.g. depressed people less likely to report income, when controlling for depression, missing is random Functional missing prob. of missing = function of a variable missingness is ignorable = do not have to model missingness property missingness has to be dealt with completely
How to deal with missings get rid of them - deletion (listwise, casewise) replace them by mean etc. who are they? - regression analysis, ANOVA what they did not tell us? imputation
Missing data in R • reserved value “NA” • important issue (build-in function have ussually no default setup for dealing with NA’s = you have to specify • is it an error? • should it be ignored (deleted)? • should it be replaced by some value (mean)? • na.rm=T (remove all cases with missing values) > a<-c(1,2,3,4,5,NA,NA) > a [1] 1 2 3 4 5 NA NA > mean(a) [1] NA #Why? Because you have not specified how to deal with NA’s. #So try the following: • > mean(a, na.rm=TRUE) • [1] 3
How many NA’s? > table(a) a 1 2 3 4 5 1 1 1 1 1 > table(a, exclude=NULL) a 1 2 3 4 5 <NA> 1 1 1 1 1 2 # to get relative counts > prop.table(table(a, exclude=NULL)) a 1 2 3 4 5 <NA> 0.1428571 0.1428571 0.1428571 0.1428571 0.1428571 0.2857143
How to find NA’s? #find complete cases (no NA’s): > complete.cases(a) [1] TRUE TRUE TRUE TRUE TRUE FALSE FALSE > b<-c(NA,NA, 1,2,3,4,5) > d<-cbind(a,b)#nyní máme matici 7x2 > d a b [1,] 1 NA [2,] 2 NA [3,] 3 1 [4,] 4 2 [5,] 5 3 [6,] NA 4 [7,] NA 5 > complete.cases(d) [1] FALSE FALSE TRUE TRUE TRUE FALSE FALSE This result can be used as an argument in another funcion that would filter out rows with missing cases.
How to remove NA’s? > d a b [1,] 1 NA [2,] 2 NA [3,] 3 1 [4,] 4 2 [5,] 5 3 [6,] NA 4 [7,] NA 5 > e<-d[complete.cases(d),] > e a b [1,] 3 1 [2,] 4 2 [3,] 5 3 > e<-d[complete.cases(d)] > e [1] 3 4 5 1 2 3 !!! Vrátí kompletní pozorování (v řádku) jako matici Vrátí kompletní pozorování (v řádku) jako numerický vektor
By the way... • this a good trick how to filter the dataset For example, you want to get Czech data only czech.data<-data[data$country==17,]
Get your Eurobarometer data... source<-file.choose() data<-read.csv(source, header = T, sep = "\t")
How to recode certain values as NA‘s? • missings in the data • system missing (no information at all) • user-defined missing (can be thought of as missing) – “don’t know”, “undecided” – but it always depends.... qf12 “Please tell me whether you totally agree, tend to agree, tend to disagree or totally disagree with the following statement: You are ready to buy environmentally friendly products even if they cost a little bit more.” • totally agree • tend to agree • tend to disagree • totally disagree • don’t know > table(data$qf12, exclude=NULL) 1 2 3 4 5 7442 12947 3636 1292 1413 data$qf12<-ifelse(data$qf12==5, NA, data$qf12) 1 2 3 4 <NA> 7442 12947 3636 1292 1413 for testing of equality, the equal sign has to be doubled (otherwise it is attribution of a value)
Look at you variables • what type of variables are you interested in? • measurment? • continuous or descrete? • how can you describe them? • are there any missings in those variables? • what type (system or user-defined)? • how many? • is that a problem?
Questions? Comments? Thank you for your attention!