Download
1 / 1
10 likes | 121 Views
QSAR MODELLING OF PERSISTENT ORGANIC POLLUTANT’S MOBILITY. 2r/P004. PAOLA GRAMATICA and STEFANO POZZI QSAR Research Unit, Dep. of Structural and Functional Biology, University of Insubria, via Dunant 3, I - 21100, Varese (Italy)

E N D
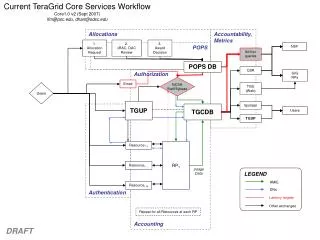
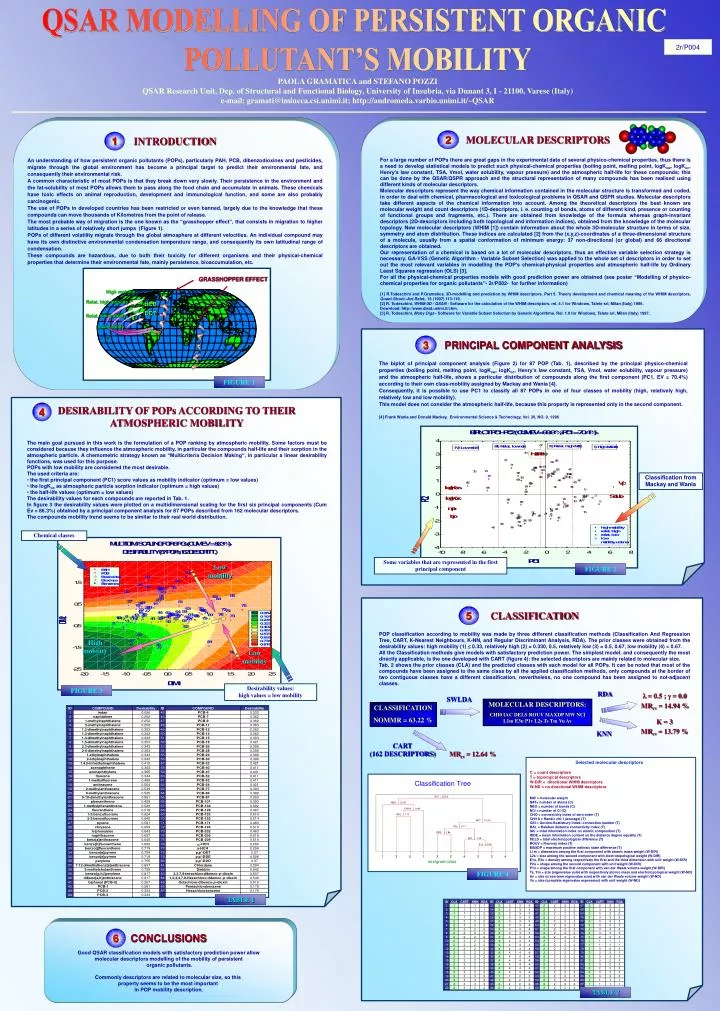
QSAR MODELLING OF PERSISTENT ORGANIC POLLUTANT’S MOBILITY 2r/P004 PAOLA GRAMATICA and STEFANO POZZI QSAR Research Unit, Dep. of Structural and Functional Biology, University of Insubria, via Dunant 3, I - 21100, Varese (Italy) e-mail: gramati@imiucca.csi.unimi.it; http://andromeda.varbio.unimi.it/~QSAR 2 1 MOLECULAR DESCRIPTORS For a large number of POPs there are great gaps in the experimental data of several physico-chemical properties, thus there is a need to develop statistical models to predict such physical-chemical properties (boiling point, melting point, logKow, logKoc, Henry’s law constant, TSA, Vmol, water solubility, vapour pressure) and the atmospheric half-life for these compounds; this can be done by the QSAR/QSPR approach and the structural representation of many compounds has been realised using different kinds of molecular descriptors. Molecular descriptors represent the way chemical information contained in the molecular structure is transformed and coded, in order to deal with chemical, pharmacological and toxicological problems in QSAR and QSPR studies. Molecular descriptors take different aspects of the chemical information into account. Among the theoretical descriptors the best known are molecular weight and count descriptors (1D-descriptors, i. e. counting of bonds, atoms of different kind, presence or counting of functional groups and fragments, etc.). There are obtained from knowledge of the formula whereas graph-invariant descriptors (2D-descriptors including both topological and information indices), obtained from the knowledge of the molecular topology. New molecular descriptors (WHIM [1]) contain information about the whole 3D-molecular structure in terms of size, symmetry and atom distribution. These indices are calculated [2] from the (x,y,z)-coordinates of a three-dimensional structure of a molecule, usually from a spatial conformation of minimum energy: 37 non-directional (or global) and 66 directional descriptors are obtained. Our representation of a chemical is based on a lot of molecular descriptors, thus an effective variable selection strategy is necessary. GA-VSS (Genetic Algorithm - Variable Subset Selection) was applied to the whole set of descriptors in order to set out the most relevant variables in modelling the POP’s chemical-physical properties and atmospheric half-life by Ordinary Least Squares regression (OLS) [3]. For all the physical-chemical properties models with good prediction power are obtained (see poster “Modelling of physico-chemical properties for organic pollutants”- 2r/P002- for further information) [1] R.Todeschini and P.Gramatica, 3D-modelling and prediction by WHIM descriptors. Part 5. Theory development and chemical meaning of the WHIM descriptors, Quant.Struct.-Act.Relat., 16 (1997) 113-119. [2] R. Todeschini, WHIM-3D / QSAR - Software for the calculation of the WHIM descriptors. rel. 4.1 for Windows, Talete srl, Milan (Italy) 1996. Download: http://www.disat.unimi.it/chm. [3] R. Todeschini, Moby Digs - Software for Variable Subset Selection by Genetic Algorithms. Rel. 1.0 for Windows, Talete srl, Milan (Italy) 1997. INTRODUCTION An understanding of how persistent organic pollutants (POPs), particularly PAH, PCB, dibenzodioxines and pesticides, migrate through the global environment has become a principal target to predict their environmental fate, and consequently their environmental risk. A common characteristic of most POPs is that they break down very slowly. Their persistence in the environment and the fat-solubility of most POPs allows them to pass along the food chain and accumulate in animals. These chemicals have toxic effects on animal reproduction, development and immunological function, and some are also probably carcinogenic. The use of POPs in developed countries has been restricted or even banned, largely due to the knowledge that these compounds can move thousands of Kilometres from the point of release. The most probable way of migration is the one known as the “grasshopper effect”, that consists in migration to higher latitudes in a series of relatively short jumps (Figure 1). POPs of different volatility migrate through the global atmosphere at different velocities. An individual compound may have its own distinctive environmental condensation temperature range, and consequently its own latitudinal range of condensation. These compounds are hazardous, due to both their toxicity for different organisms and their physical-chemical properties that determine their environmental fate, mainly persistence, bioaccumulation, etc. GRASSHOPPER EFFECT High mobility Relat. high mobility HCB DDT Relat. low mobility Low mobility 3 PRINCIPAL COMPONENT ANALYSIS The biplot of principal component analysis (Figure 2) for 87 POP (Tab. 1), described by the principal physico-chemical properties (boiling point, melting point, logKow, logKoc, Henry’s law constant, TSA, Vmol, water solubility, vapour pressure) and the atmospheric half-life, shows a particular distribution of compounds along the first component (PC1, EV = 70.4%) according to their own class-mobility assigned by Mackay and Wania [4]. Consequently, it is possible to use PC1 to classify all 87 POPs in one of four classes of mobility (high, relatively high, relatively low and low mobility). This model does not consider the atmospheric half-life, because this property is represented only in the second component. [4] Frank Wania and Donald Mackay, Environmental Science & Technology, Vol. 30, NO. 9, 1996 FIGURE 1 • DESIRABILITY OF POPs ACCORDING TO THEIR • ATMOSPHERIC MOBILITY • The main goal pursued in this work is the formulation of a POP ranking by atmospheric mobility. Some factors must be considered because they influence the atmospheric mobility, in particular the compounds half-life and their sorption in the atmospheric particle. A chemometric strategy known as “Multicriteria Decision Making“, in particular a linear desirability functions, was used for this purpose. • POPs with low mobility are considered the most desirable. • The used criteria are: • the first principal component (PC1) score values as mobility indicator (optimum = low values) • the logKoc as atmospheric particle sorption indicator (optimum = high values) • the half-life values (optimum = low values) • The desirability values for each compounds are reported in Tab. 1. • In figure 3 the desirability values were plotted on a multidimensional scaling for the first six principal components (Cum Ev = 86.3%) obtained by a principal component analysis for 87 POPs described from 162 molecular descriptors. • The compounds mobility trend seems to be similar to their real world distribution. 4 Classification from Mackay and Wania Chemical classes Some variables that are represented in the first principal component Low mobility FIGURE 2 5 CLASSIFICATION POP classification according to mobility was made by three different classification methods (Classification And Regression Tree, CART, K-Nearest Neighbours, K-NN, and Regular Discriminant Analysis, RDA). The prior classes were obtained from the desirability values: high mobility (1) 0.33, relatively high (2) = 0.330, 0.5, relatively low (3) = 0.5, 0.67, low mobility (4) > 0.67. All the Classification methods give models with satisfactory prediction power. The simplest model, and consequently the most directly applicable, is the one developed with CART (figure 4): the selected descriptors are mainly related to molecular size. Tab. 2 shows the prior classes (CLA) and the predicted classes with each model for all POPs. It can be noted that most of the compounds have been assigned to the same class by all the applied classification methods, only compounds at the border of two contiguous classes have a different classification, nevertheless, no one compound has been assigned to not-adjacent classes. High mobility Low mobility Desirability values: high values = low mobility FIGURE 3 RDA = 0.5 ; = 0.0 MRcv = 14.94 % SWLDA MOLECULAR DESCRIPTORS: CHI0 IAC DELS ROUV MAXDP MW NCl L1m E3u P1v L2s Ts Tm Vu Av CLASSIFICATION NOMMR = 63.22 % K = 3 MRcv = 13.79 % KNN CART (162 DESCRIPTORS) MRcv = 12.64 % Selected molecular descriptors C = count descriptors T = topological descriptors W-DIR = directional WHIM descriptors W-ND = no directional WHIM descriptors MW= molecular weight NAT= number of atoms (C) NBO = number of bonds (C) NCl= number of Cl (C) CHI0 = connectivity index of zero-order (T) CHI1A = Randic chi-1 (average) (T) GSI = Gordon-Scatlebury index: connection number (T) BAL = Balaban distance connectivity index (T) IAC = total information index on atomic composition (T) IDDE = mean information content on the distance degree equality (T) DELS = total electrotopological difference (T) ROUV= Rouvray index (T) MAXDP= maximum positive intrinsic state difference (T) L1m= dimension among the first component with atomic mass weight (W-DIR) L2s = size among the second component with electrotopological weight (W-DIR) E1u, E3u = density among respectively the first and the third dimension with unit weight (W-DIR) P2u = shape among the second component with unit weight (W-DIR) P1v = shape among the first component with van der Waals volume weight (W-DIR) Ts, Tm= size (eigenvalue sum) with respectively atomic mass and electrotopological weight (W-ND) Av = size (cross-term eigenvalue sum) with van der Waals volume weight (W-ND) Vu = size (complete eigenvalue expression) with unit weight (W-ND) FIGURE 4 TABLE 1 CONCLUSIONS Good QSAR classification models with satisfactory prediction power allow molecular descriptors modelling of the mobility of persistent organic pollutants. Commonly descriptors are related to molecular size, so this property seems to be the most important in POP mobility description. 6 TABLE 1 TABLE 2