Download
1 / 1
10 likes | 119 Views
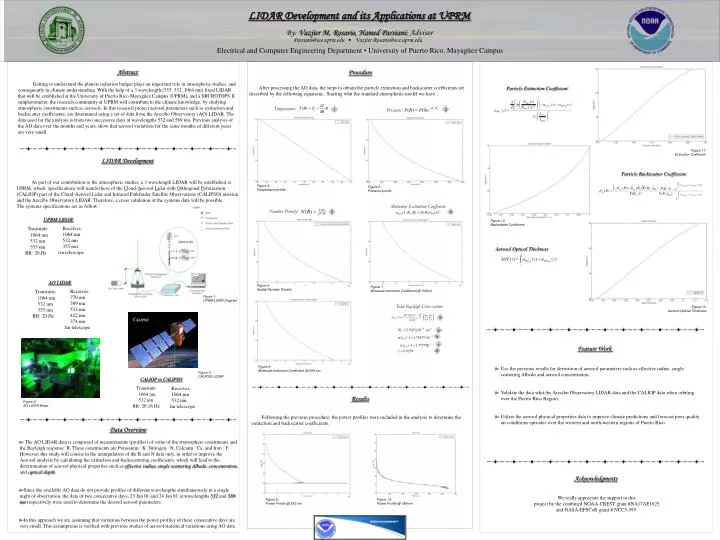
By: Vazjier M. Rosario, Hamed Parsiani: Advisor. Parsiani@ece.uprm.edu • Vazjier.Rosario@ece.uprm.edu. Total Rayleigh Cross section. 5. a. b. c. 2. d. Data Overview. Figure 11: Extinction Coefficient.

E N D
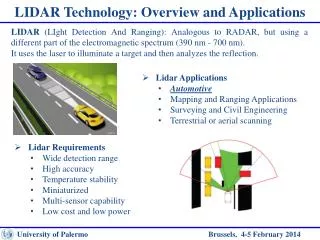
By: Vazjier M. Rosario, Hamed Parsiani: Advisor Parsiani@ece.uprm.edu • Vazjier.Rosario@ece.uprm.edu Total Rayleigh Cross section 5 a b c 2 d Data Overview Figure 11: Extinction Coefficient • The AO LIDAR data is composed of measurements (profiles) of some of the stratosphere constituents and the Rayleigh response: R. These constituents are Potassium : K Nitrogen : N, Calcium : Ca, and Iron : F. However, this study will consist in the manipulation of the R and N data only, in order to improve the Aerosol analysis by calculating the extinction and backscattering coefficients, which will lead to the determination of aerosol physical properties such as effective radius, single scattering Albedo, concentration, and optical depth. • Since the available AO data do not provide profiles of different wavelengths simultaneously in a single night of observation, the data of two consecutive days, 23 Jan 01 and 24 Jan 01 at wavelengths 532 and 589 nm respectively were used to determine the desired aerosol parameters. • In this approach we are assuming that variations between the power profiles of these consecutive days are very small. This assumptions is verified with previous studies of aerosol statistical variations using AO data. Figure 5: Pressure profile Temperature: Pressure: Figure 4: Temperature profile 1 CALIOP in CALIPSO Transmits: 1064 nm 532 nm RR: 20.16 Hz AO LIDAR Transmits: 1064 nm 532 nm 355 nm RR: 20 Hz Molecular Extinction Coefficient: Receives: 1064 nm 532 nm 1m telescope Receives: 770 nm 589 nm 532 nm 422 nm 374 nm 1m telescope Number Density: 3 4 Figure 12: Backscatter Coefficient Figure 1: UPRM LIDAR Diagram Figure 6: Spatial Number Density Figure 7: Molecular extinction Coefficient @ 532nm Figure 13: Aerosol Optical Thickness Figure 3: CALIPSO LIDAR Figure 8: Molecular extinction Coefficient @ 589 nm Figure 2: AO LIDAR Beam Figure 9: Power Profile @ 532 nm Figure 10: Power Profile @ 589 nm LIDAR Development and its Applications at UPRM Electrical and Computer Engineering Department • University of Puerto Rico, Mayagüez Campus Abstract Procedure Getting to understand the planets radiation budget plays an important role in atmospheric studies, and consequently in climate understanding. With the help of a 3 wavelength (355, 532, 1064 nm) fixed LIDAR that will be established at the University of Puerto Rico Mayagüez Campus (UPRM), and a MICROTOPS II sunphotometer, the research community at UPRM will contribute to the climate knowledge, by studying atmospheric constituents such as aerosols. In this research project aerosol parameters such as extinction and backscatter coefficients, are determined using a set of data from the Arecibo Observatory (AO) LIDAR. The data used for the analysis is from two successive days at wavelengths 532 and 589 nm. Previous analysis of the AO data over the months and years, show that aerosol variations for the same months of different years are very small. After processing the AO data, the steps to obtain the particle extinction and backscatter coefficients are described by the following equations . Starting whit the standard atmospheric model we have : Particle Extinction Coefficient LIDAR Development Particle Backscatter Coefficient As part of our contribution to the atmospheric studies, a 3 wavelength LIDAR will be established at UPRM, which specifications will match those of the Cloud-Aerosol Lidar with Orthogonal Polarization (CALIOP) part of the Cloud-Aerosol Lidar and Infrared Pathfinder Satellite Observations (CALIPSO) mission and the Arecibo Observatory LIDAR. Therefore, a cross validation of the systems data will be possible. The systems specifications are as follow: UPRM LIDAR Transmits: 1064 nm 532 nm 355 nm RR: 20 Hz Receives: 1064 nm 532 nm 355 nm 1m telescope Aerosol Optical Thickness Feature Work • Use the previous results for derivation of aerosol parameters such as effective radius, single scattering Albedo and aerosol concentration. • Validate the data whit the Arecibo Observatory LIDAR data and the CALIOP data when orbiting over the Puerto Rico Region. • Utilize the aerosol physical properties data to improve climate predictions and forecast poor quality air conditions episodes over the western and north-western regions of Puerto Rico. Results Following the previous procedure, the power profiles were included in the analysis to determine the extinction and backscatter coefficients. Acknowledgments We really appreciate the support to this project by the combined NOAA-CREST grant #NA17AE1625 and NASA-EPSCoR grant # NCC5-595.