Download
1 / 30
300 likes | 420 Views
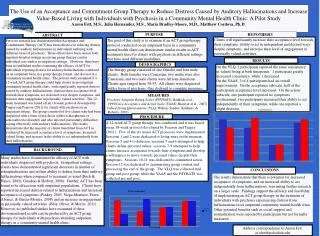
West Bank Demographics. Cedar / Riverside Race and Ethnicity, 1990-2000. Source: U.S. Census, Geolytics. Cedar / Riverside Language Spoken at Home for Persons Ages 5-17 in 2000. Source: U.S. Census, Geolytics. Minneapolis Schools Demographics.

E N D
Cedar / Riverside Race and Ethnicity, 1990-2000 Source: U.S. Census, Geolytics
Cedar / Riverside Language Spoken at Home forPersons Ages 5-17 in 2000 Source: U.S. Census, Geolytics
Job Growth by Location of Job Center Job Center Type % Growth in Jobs (90-00) Central Business Districts 6% Other Central City Centers 10% Inner Suburb 17% Middle Suburb 19% Outer Suburb 32% Total – Employment Centers 14% Nonclustered Employment 31% Total – Metropolitan Area 22%
Percentage of Regional Total Non-Hispanic Job Center Type White Black Other Hispanic Declining Employment 10 16 15 14 Slow Growth (0 - 20%) 21 33 25 25 Moderate Growth (20 - 40%) 13 11 14 13 High Growth (> 40%) 7 6 8 7 Total - Employment Ctrs. 51 65 62 57 Non-clustered Employment 49 35 38 43 Total - Metropolitan Area 100 100 100 100 Racial Breakdown by Job Growth Rates )