Download
1 / 4
40 likes | 135 Views
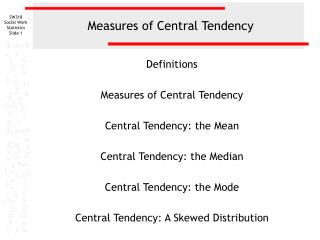
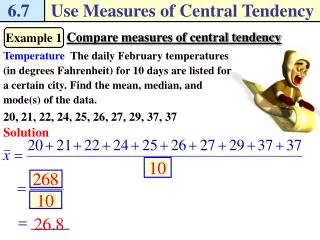
Sec. 2-7: Using Measures of Central Tendency. Measures of Central Tendency = “Averages” Mean: Add ALL of the data together and divide by the quantity of data you have. i.e. 4, 7, 10, 3, 5, 6 4 + 7 + 10 + 3 + 5 + 6 = 35 6 6 mean = 5.833 Look at example #1 on p. 119.

E N D
Measures of Central Tendency = “Averages” • Mean: Add ALL of the data together and divide by the quantity of data you have. i.e. 4, 7, 10, 3, 5, 6 4 + 7 + 10 + 3 + 5 + 6 = 35 6 6 mean = 5.833 Look at example #1 on p. 119
Outlier: A data value that is much HIGHER or LOWER than the rest of the data values. i.e. 1, 26, 28, 32, 36, 37, 40, 43 • Median: The MIDDLE number of a set of ORDERED data. ***The data must be arranged IN ORDER, if you are left with 2 data in the center, AVERAGE them. i.e. 4, 12, 3, 5, 8, 6
Mode: The number(s) that appear(s) the MOST. Refer to example 1 on p. 119 • Range: The DIFFERENCE between the MAXIMUM and MINIMUM data values. i.e. 3, 7, 10, 5, 4, 2, 22, 12, 13 22- 2 = 20