Download
1 / 24
240 likes | 390 Views
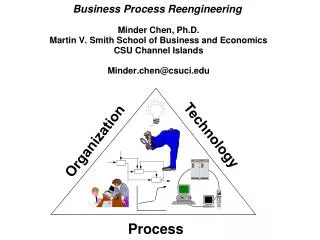
Business Process Reengineering Class Session 5 – Fall 1385. Toolbox for Improvements Departments or Processes? Organizing Improvements Process Documentation Performance Management. Process Toolbox Anderson Ch. 1-4. Departments or Processes?. Departments: Specialized skills

E N D
Business Process ReengineeringClass Session 5 – Fall 1385 Toolbox for Improvements Departments or Processes? Organizing Improvements Process Documentation Performance Management Process Toolbox Anderson Ch. 1-4
Departments or Processes? • Departments: • Specialized skills • Workforce secure • Lower cost • Clear Org structure • Processes • Focus on customers • Value creation • Requirements understood • Reduce sub-optimization • Time/resource control Example: Salesperson reserves order “in the drawer” for next period
Business Process . . A logical series of related transactions that converts inputs to outputs or results. • a chain of logical connected, repetitive activities • utilizes the enterprise’s resources • refine an object (physical or mental) • for a purpose of specific /measurable results/products • internal or external customers
Classification of Business Processes Primary Processes Central & value-creating Support Indirect to support primary Development Take to higher performance
Why Process Improvements? • Performance tend to decrease over time. • Your competitors will improve processes. • Customer expectations /demands are exceeding.
Organizing Improvements • Planning: analyze the problem & plan activities to remedy it. • Doing: carry out the activities, experiment with the solution. • Checking: evaluate activities with planned measurements. • Acting: modifying process by confirmed results activities. • Systematic approach for continually improving!!
Team Leader Management Link Process Owner Cross-section organization units Process Customer Process Supplier External Assistance Requirements for Members Time to participate Competencies and knowledge Motivation Cooperate, listen, communicate Credibility, respect Team for Process Improvement
Process for Process Improvement1- Process Documentation • Need to know current state, before deciding which improvements to make. • Documenting one by one in connection with the specific processes. • Documenting all processes at once at the start of improvement journey. • A common understanding of the content of processes & activities • Scope of the processes, and boundaries to adjacent processes. • Specific problems, if possible to define, within the process.
Relationship Mapping Overall picture of who are part of the process and what relationship they have to one another and to the rest of the world. For more extensive & more complicated processes with a number of individuals or departments exchanging goods and information. It does not consider the details of activities or their sequence in the processes.
Case: A large international corporation with one central manufacturing site
Start or finishing point Step or activity in the process Decision point Input or Output Document Flowchart Flowchart is a graphic depiction of activities in a process.
Flowchart with • Time • Cost • Completion • Value added
Several-leveled Flowcharts Top chart Second-level Charts
From Departments to Processes
Performance Measurement You cannot manage, what you cannot measure! What gets measured, gets done! Measurement impacts behavior! Variation of truth! • Measurement is threatening! • Precision is essential for useful measurement! • Subjective measures are sloppy! • Standards are necessary and sufficient!
Hard versus Soft Measures Deming: Most important numbers are not known. Customer Satisfaction or Employee Satisfaction. Quality of atmosphere in a meeting room
Financial Measures Total sales Profit Margin Value added Turnover of capital Non-financial Measures Set-up Time Delivery Time Defect Rate Customer Satisfaction Financial versus Non-financial Measures
Results versus Process Measures Western versus Japanese attitudes A manager of a large agricultural collective in the former Soviet Union three years in a row won the prize for the most productive collective. The performance measure used was the number of kilos of meat produced per year. The fourth year, he shot himself… He had no breeding stock left.
Results Measures Net Profit Return on Investment Market Share Diagnostic Measures Delivery Precision Delivery Flexibility Lead Times Customer Satisfaction Competence Measures Investment in Product Development Attitude towards Change Flexibility to Deliver New Products Training Levels Measures defined according to purpose