Download
1 / 1
10 likes | 160 Views
EMET - York. 2. 1.8. 1.6. 1.4. 1.2. S. c. Student Performance. o. 1. Faculty Perception. r. Student Self Perception. e. 0.8. Student Course Perception. 0.6. 0.4. 0.2. 0. 1. 2. 3. 4. 5. 6. 7. 8. 9. 10. 11. 12. Program Outcomes.

E N D
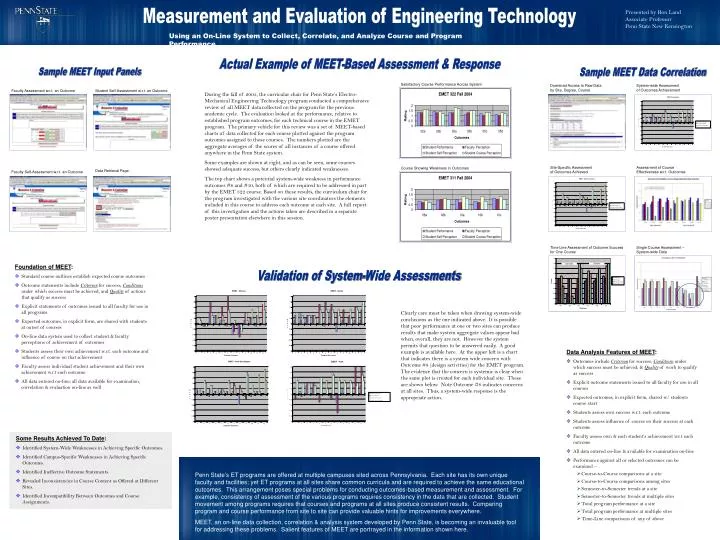
EMET - York 2 1.8 1.6 1.4 1.2 S c Student Performance o 1 Faculty Perception r Student Self Perception e 0.8 Student Course Perception 0.6 0.4 0.2 0 1 2 3 4 5 6 7 8 9 10 11 12 Program Outcomes Measurement and Evaluation of Engineering Technology Presented by Ron LandAssociate ProfessorPenn State New Kensington Using an On-Line System to Collect, Correlate, and Analyze Course and Program Performance Actual Example of MEET-Based Assessment & Response Sample MEET Input Panels Sample MEET Data Correlation Satisfactory Course Performance Across System Download Access to Raw Data by Site, Degree, Course System-wide Assessment of Outcomes Achievement During the fall of 2005, the curricular chair for Penn State’s Electro-Mechanical Engineering Technology program conducted a comprehensive review of all MEET data collected on the program for the previous academic cycle. The evaluation looked at the performance, relative to established program outcomes, for each technical course in the EMET program. The primary vehicle for this review was a set of MEET-based charts of data collected for each course plotted against the program outcomes assigned to those courses. The numbers plotted are the aggregate averages of the scores of all instances of a course offered anywhere in the Penn State system. Some examples are shown at right, and as can be seen, some courses showed adequate success, but others clearly indicated weaknesses. The top chart shows a potential system-wide weakness in performance outcomes #8 and #10, both of which are required to be addressed in part by the EMET 322 course. Based on these results, the curriculum chair for the program investigated with the various site coordinators the elements included in this course to address each outcome at each site. A full report of this investigation and the actions taken are described in a separate poster presentation elsewhere in this session. Faculty Assessment w.r.t. an Outcome Student Self-Assessment w.r.t. an Outcome Site-Specific Assessment of Outcomes Achieved Assessment of Course Effectiveness w.r.t. Outcomes Course Showing Weakness in Outcomes Data Retrieval Page Faculty Self-Assessment w.r.t. an Outcome Time Line Assessment of Outcome Success for One Course Single Course Assessment – System-wide Data • Foundation of MEET: • Standard course outlines establish expected course outcomes • Outcome statements include Criterion for success, Conditions under which success must be achieved, and Quality of actions that qualify as success • Explicit statements of outcomes issued to all faculty for use in all programs • Expected outcomes, in explicit form, are shared with students at outset of courses • On-line data system used to collect student & faculty perceptions of achievement of outcomes • Students assess their own achievement w.r.t. each outcome and influence of course on that achievement • Faculty assess individual student achievement and their own achievement w.r.t each outcome • All data entered on-line; all data available for examination, correlation & evaluation on-line as well Validation of System-Wide Assessments Clearly care must be taken when drawing system-wide conclusions as the one indicated above. It is possible that poor performance at one or two sites can produce results that make system aggregate values appear bad when, overall, they are not. However the system permits that question to be answered easily. A good example is available here. At the upper left is a chart that indicates there is a system wide concern with Outcome #8 (design activities) for the EMET program. The evidence that the concern is systemic is clear when the same plot is created for each individual site. These are shown below. Note Outcome #8 indicates concerns at all sites. Thus, a system-wide response is the appropriate action. • Data Analysis Features of MEET: • Outcomes include Criterion for success, Conditions under which success must be achieved, & Quality of work to qualify as success • Explicit outcome statements issued to all faculty for use in all courses • Expected outcomes, in explicit form, shared w/ students course start • Students assess own success w.r.t. each outcome • Students assess influence of course on their success at each outcome • Faculty assess own & each student’s achievement w.r.t each outcome • All data entered on-line & available for examination on-line • Performance against all or selected outcomes can be examined – • Course-to-Course comparisons at a site • Course-to-Course comparisons among sites • Semester-to-Semester trends at a site • Semester-to-Semester trends at multiple sites • Total program performance at a site • Total program performance at multiple sites • Time-Line comparisons of any of above • Some Results Achieved To Date: • Identified System-Wide Weaknesses in Achieving Specific Outcomes. • Identified Campus-Specific Weaknesses in Achieving Specific Outcomes. • Identified Ineffective Outcome Statements. • Revealed Inconsistencies in Course Content as Offered at Different Sites. • Identified Incompatibility Between Outcomes and Course Assignments. Penn State’s ET programs are offered at multiple campuses sited across Pennsylvania. Each site has its own unique faculty and facilities; yet ET programs at all sites share common curricula and are required to achieve the same educational outcomes. This arrangement poses special problems for conducting outcomes-based measurement and assessment. For example, consistency of assessment of the various programs requires consistency in the data that are collected. Student movement among programs requires that courses and programs at all sites produce consistent results. Comparing program and course performance from site to site can provide valuable hints for improvements everywhere. MEET, an on-line data collection, correlation & analysis system developed by Penn State, is becoming an invaluable tool for addressing these problems. Salient features of MEET are portrayed in the information shown here.