Download
1 / 33
360 likes | 473 Views
How ICT can assist Energy Efficient Fleet Operations Digital Ship Hamburg 1 – 2 February 2012. Hideyuki Ando Technical Strategy Group, MTI (Monohakobi Technology Institute) R&D company of NYK Line. Outline. Background Energy Efficient Fleet Operation Performance monitoring

E N D
How ICT can assist Energy Efficient Fleet Operations Digital Ship Hamburg 1 – 2 February 2012 Hideyuki Ando Technical Strategy Group, MTI (Monohakobi Technology Institute) R&D company of NYK Line
Outline • Background • Energy Efficient Fleet Operation • Performance monitoring • Data analytics • Conclusion remarks
Save bunker activities in shipping company • According to increased cost of bunker, shipping companies have applied operational and technical measures for fuel savings • Slow steaming • Weather routing • Propeller cleaning • Energy saving devices Cost benefit and emission reduction by slow steaming e.g. 8,000 TEU container Slow steaming - 16 % - 42 %
Performance monitoring- compare total fuel consumption or EEOI • Same ship size and same voyage – but total amounts of fuel consumption largely differ More than 30 % difference
SEEMP - PDCA management for energy efficiency • SEEMP (Ship Energy Efficiency Management Plan) • MEPC 62 adopted revisions of MARPOL Annex VI introducing EEDI and SEEMP • Entry into force date: 1 January 2013 • Operational measures • slow steaming • weather routing • hull and propeller maintenance • …. Plan Do Check Act Continuous monitoring & improvement
Best balance of safety, economy and environment No cargo and ship damage Keep schedule Maximize charter base (minimize cost) Minimize emissions Fleet operation Snapshot from NYK e-Missions’ NYK fleet: about 800 vessels now
Management for energy efficient operation- Needs all related parties participation Plan – routing Do - navigation PDCA cycle for improvement Act – corrective action Check – monitoring To encourage all participants efforts for energy efficient operation by sharing information, good communication and right scheme
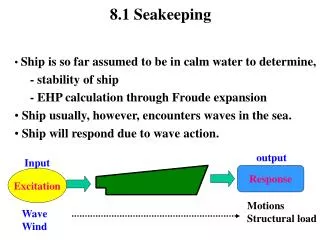
Optimum weather routing • Role of weather routing • (past) Avoiding severe weather • (now) Optimum weather routing Best balance of • Safety • Schedule keep • Economy • Environment • Necessary technology for optimum weather routing • Ship performance model • RPM – speed – fuel consumption • Ship motion and performance in severe weather Way points Routes and weather
Integration of weather routing and monitoring Weather Routing(PLAN) Monitoring(CHECK) • Voyage plan • + course, speed, RPM, FOC, weather • + ship performance model • Voyage actual • + actual speed – RPM, RPM - FOC • + actual weather Feedback Ship model and weather forecast are inherently include errors. But feedback loop by monitoring can make this system work better.
Fleet monitoring at shore • Shore operation manages fleet • Keep safety, schedule and minimize cost • Provide awareness by comparing voyage plan and monitoring data
Action Decision making Monitoring target Awareness Performance monitoring Performance monitoring for right awareness • If awareness is wrong, decision making and action will be wrong • Share correct and necessary information in right time by utilizing ICT
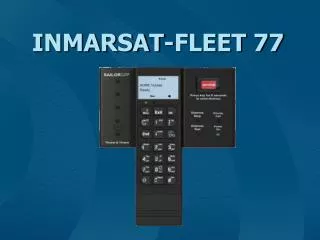
Example implementation ofdata collection box onboard Flow meter • Requirements • Interface to onboard equipment, such as engine D/L, GPS, anemometer, flow meter and etc. • High reliability … 24 hrs, 365 days work withoutmaintenance • Lower cost of implementation • Flexibility of customization FUELNAVI
Inmarsat-FB or VSAT FUELNAVI schematic diagram Ship’s LAN SIMS junction box • Box Computer • (MOXA) • data storage • data transfer Motion Sensor serial serial GPS (speed, course) NMEA • FuelNavi • (PLC: Mitsubishi • MELSEC-Q) • Data processing • Calculate statistics Doppler log (speed) NMEA Gyro compass (heading) NMEA • GOT monitor • Fuel consumption • monitor Anemometer (rel. wind) NMEA serial / LAN Bridge serial / LAN E/C Engine Data Logger RPM 4-20 mA Master clock pulse F.O. flow meter pulse Sea water temp. 4-20 mA S.H.P 4-20 mA E/R temp. 4-20 mA F.O. temperature 4-20 mA
Interval of monitoring data Data interval comparison red: OG speed, black: log speed Ship type: VLCC • Existing data collection approaches • Manual reporting (every 24 hrs) • Automatic data collection (sampling can be every 1 sec) • Every 1 hour data give detail information about performance • Speed increasing profile and effect of current can be seen in the 1 hour interval graph. time (hour) Data interval: 24 hours time (hour) Data interval: 1 hour
Onboard performance monitoring • Real time performance indicator in bridge • Provide awareness to ship • Performance index • OG speed / fuel consumption [NM/MT] • Fuel consumption [MT/day] • Trip meter function for onboard performance trial • Energy efficiency comparison FUELNAVI monitor
Analysis and identify Identify each cause of fuel consumption • By using detail monitoring data and appropriate analysis methods, total FOC can be breakdown into each cause. • It will be the key concept for SEEMP management too. Effect of distance increase Effect of speed allocation Effect of speed increase Effect of weather Total FOC Generator use Effect of ship hull condition Effect of draft and trim Ship base performance
Factors of additional fuel consumption • Higher average speed than planned speed • Longer voyage distance than planned distance • Effect of bad weather and against current • Speed allocation • Effect of displacement and trim • Ship design difference • Maintenance condition of engine, propeller or hull
Identify baseline and added FOC by weather FOC at average 129 MT/day (Added FOC by weather = 12 MT/day) FOC at calm 117 MT/day Pro forma speed (planned speed) 21.5 knot 22
As the result of break down analysis, factors for additional FOC in the voyage are shown quantitatively Compare each FOC factor with past average provides qualitative information Speed allocation Breakdown analysis of additional FOC FOC [MT]
Good practice • Check point of eco voyage • No drifting, No early arrival • Reduce speed in rough weather • Constant M/E load OAKLAND - TOKYO M/E RPM Speed (log, SOG) Constant M/E load Optimum M/E load Speed [knot] M/E load Slip as weather index time [day] Additional FOC: comparison to optimum M/E load = 0.5 %
Practice can be improved • Check point of eco voyage • No drifting, No early arrival • Reduce speed in rough weather • Constant M/E load OAKLAND - TOKYO Reduce speed at rough sea M/E RPM Speed (log, SOG) Higher M/E load Optimum M/E load Speed [knot] M/E load Encounter rough sea Slip as weather index time [day] drifting Additional FOC: comparison to optimum M/E load = 8,2 %
Feedback actual weather • Measured wind and ship motion data are feedback to weather routing provider Actual wind speed (measured) Forecast wind speed Ship motion (Maximum roll angle in one hour) Wave height (forecast)
Compare estimated ship motion with actual [sec] ship motion simulation actual ship motion and acceleration criteria cargo securing & ship structural safety
Viewer Data Center SIMS Overview(Ship Information Management System) Weather routing service provider SIMS auto logging data (per hour) & SPAS electronic abstract logbook data (per day) SIMS Monitoring & Analysis System at Shore SIMS Data Collection System Onboard Inmarsat-F/FB Communications via Technical Management Feedback to captains Operation Center Singapore, …. • GPS • Doppler log • Anemometer • Gyro Compass FuelNavi Report Voyage Analysis Report Break down analysis of fuel consumption for each voyage VDR / ECDIS • SIMS Viewer • Trend monitoring of speed, M/E RPM, fuel consumption and other conditions per hour • Comparing planned schedules and actual schedules Data Acquisition and Processing Motion sensor <Navigation Bridge> Technical Analysis (MTI) <Engine Room> • Main Engine • FO flow meter • Torque meter Engine Data Logger
Information sharing by real-time and broadband network 15 days forecast 1/12 resolution current Voyage simulation shore Voyage simulation onboard Large data size transfer Maritime broad band (FBB, VSAT) Full time connection Route manager (captain and engineer at shore) vessel Feedback to ship performance model Revise schedule by real-time information Feedback actual weather Actual RPM model Actual sea state Calibration Calibrated model Recommend RPM speed actual Actual wind & ship motion rpm Recommend speed
Concluding remarks • Information sharing among all related parties and cooperation are the key for energy efficiency • Integration of weather routing and performance monitoring is a base system for energy efficient fleet management • Automatic data collection onboard provides high quality and large data sample for making data analytics • High level integration of weather routing, performance monitoring, real-time broadband network and organizations are our next challenges
To Achieve Best Balance of Safety, Economy and Environment September 2011 rev.5 CO2 minimize Roadmap of performance monitoring NYK e-Missions’ • SEEMP package • Voyage planning • Monitoring • Evaluation and action Best balance S.E.E. Weather Routing for Safety • Optimum Fleet Management • C/B maximize with weather routing • and monitoring • Minimum emissions with SEEMP • Safety management at rough sea 2009 - 2012 - Optimum Weather Routing Safety + Economy + Schedule 2014 - 2009 - • Real time Weather Routing • & Monitoring • Real time communication • Precise ship performance model • Onboard sea-keeping simulation Broadband Network • Smart Ship • Minimize emissions • Integration of navigation • equipment and weather routing • Automatic performance model • identification 2014 - Onboard Weather Routing Trial Weather Routing & SIMS Monitoring 2010 - 2012 - 2005 - 2006 Wave Sensor • Accurate Performance Monitoring • and feedback to Ship Design • Accurate wave and wind measurement • Accurate torque and thrust measurement • Accurate log speed measurement • Accurate fuel consumption measurement • Ship performance model Now Performance Monitoring Fuel Consumption Monitor FUELNAVI 2010 - • Technical Performance • Analysis • Ship appendages • Paint • M/E governor • New design propeller Fleet Monitoring 2007 - 2008 2009 - 2012 - Ship Monitoring SIMS Feedback to Shipyards & new design EEDI validation 2008 - 2008 - Electronic Ablog SPAS 2006 - • Performance Validation of • Low Emission Machineries • Hybrid Turbo Charger • Battery (Giga Cell) • W.H.R 2011 -