Download
1 / 34
340 likes | 351 Views
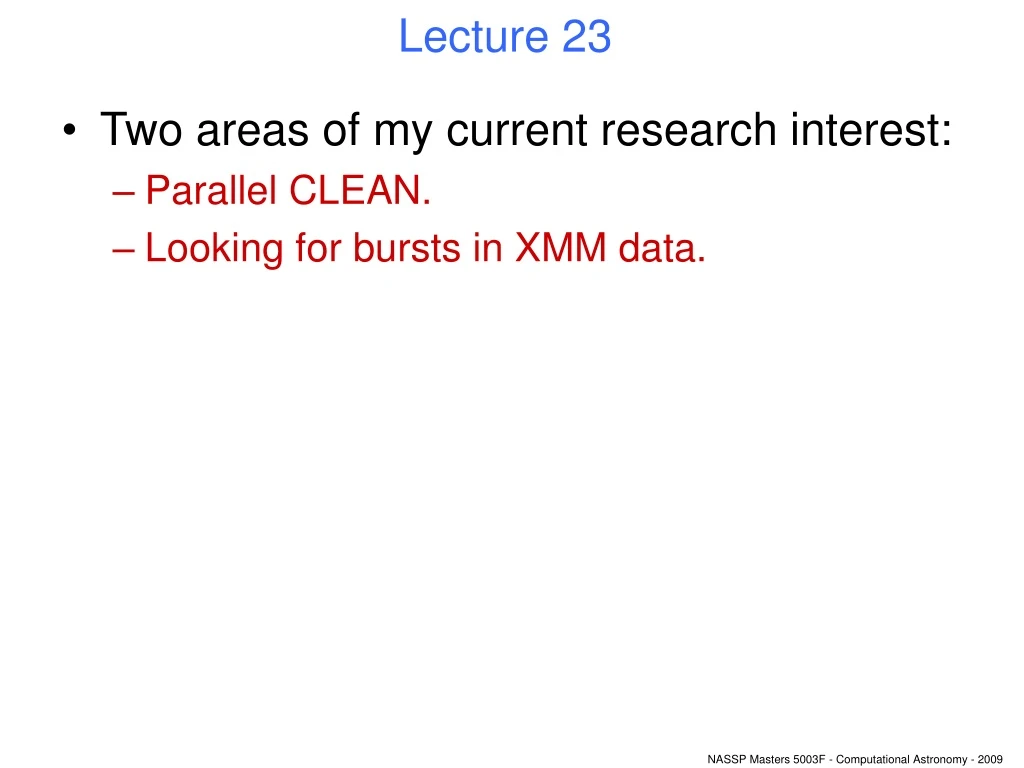
Lecture 23. Two areas of my current research interest: Parallel CLEAN. Looking for bursts in XMM data. Applications of parallel CLEAN. I’ve told you something about this already. In lecture 15. There you had the nice pix, here we learn more about the nuts and bolts.

E N D
Lecture 23 • Two areas of my current research interest: • Parallel CLEAN. • Looking for bursts in XMM data.
Applications of parallel CLEAN • I’ve told you something about this already. • In lecture 15. There you had the nice pix, here we learn more about the nuts and bolts. • The original CLEAN is a technique for deconvolving images made by aperture synthesis. • CLEAN relies upon the assumption that the dirty image D can be described as a convolution between the dirty beam B and a ‘true sky image’ I which is supposed to be a set of point sources. Ie or
Applications of parallel CLEAN • It turns out that there are quite a few cases where this assumption breaks down. Eg • If the observation bandwidth is large enough that the different spectral shape of different parts of the sky can no longer be neglected. • This was the original application. • If the observed sky contains sources which vary over the duration of the observation. • Even if a point source is not located exactly in the centre of an image pixel, the assumption breaks down.
Applications of parallel CLEAN • The Sault-Wieringa algorithm, as applied to the wide-band situation, approximates the spectrum S at each sky position by a sum over basis functions fj: Here the Aj(r) are amplitudes which will vary over the sky. • The basis function in the original paper were Taylor-series power functions, but any set which spans the space of possible spectra would do as well.
Applications of parallel CLEAN • The algorithm then constructs, not one, but M beams. The jth beam is constructed from visibilities appropriate to a point source at the phase centre and with a spectrum equal to fj. • The dirty image can then be expressed as a sum of convolutions: • The algorithm finds the brightest pixel at each iteration, but then calculates the amount of each beam present, and subtracts λ times each from the residual image.
Parallel CLEAN of time-varying sources. • There’s no reason why this can’t be extended to sources which vary with time, or even time- and spectrum-variable sources. It is just necessary to expand the flux in the appropriate set of basis functions: • There are, however, a couple of issues, both arising out of the ‘more wiggly’ nature of many radio time series, as compared to spectra.
Problems caused by rapid time variation • A radio spectrum nearly always is a slowly-varying function of frequency. Over a fractional bandwidth of up to a decade (ie, a ten-fold change), many can be quite well approximated by a simple power law. • A power law doesn’t need many terms of a Taylor series – 3 at maximum – for a good approximation. • Time series may need many more orders for good approximation – and for this, a Taylor series begins to seem not the best choice of basis function.
Problems caused by rapid time variation • Other possibilities: • A Fourier series. • Chebyshev (or Tchebyshev) polynomials. We’ll consider both in a little while. First let’s discuss the other problem: • Suppose we consider the full frequency-time variation. If we use for example 3 orders of frequency basis function f and 9 orders of time basis function g (not unreasonable), that means we need 3 x 9 = 27 beams. • It gets worse than this because, within the S-W algorithm, we must store 27x27 = 729 internal arrays!
Gram-Schmidt orthogonalization • It turns out that we only need NxN arrays if the beams are non-orthogonal. If we make them orthogonal, just N (27 in our example) are needed – a substantial saving not just in memory use, but also in speed. • The beams can be orthogonalized by a Gram-Schmidt process. • But... what does it mean to say that two images are ‘orthogonal’? Images aren’t vectors! • Anything for which a scalar product can be defined can be treated like a generalized vector. Eg for two images I and B:
Gram-Schmidt v1 v1 v1 v1 v2 v2 v2 v2 v1 u1 u1 u1 u1 v2 (v2·u1)u1 v2-(v2·u1)u1 u2 u1 = v1/|v1| u2 = (v2-[v2·u1]u1)/|same| u3 = (v3-[v3·u1]u1-[v3·u2]u2)/|same| etc
Gram-Schmidt • However, for parallel clean, we need to be able to recover the old basis. So we express the relation between vs and us via a matrix of coefficients: • G is lower-triangular, with elements: • gi,I = |ui| • gi,j = <uj|vi> for j<i. • Somewhat surprisingly, construction of G is ill-conditioned – ie ok in theory, but in practice the errors accumulate and soon grow to dominate. • Somewhat greater cunning is needed.
The Wikipedia algorithm: • I’m not kidding, there’s a good article on Gram-Schmidt on Wikipedia. (There’s nothing in Press et al for once.) • This is pretty stable. # In pythonish language: u = v[i] for i in range(len(v)): g[i,i] = <u[j]|v[i]> u[i] = u[i] – g[i,j]*u[j] g[i,i] = sqrt(<u[i]|u[i]>) u[i] = u[i] / g[i,i]
Basis sets: (i) Fourier series. • This is standard stuff, and easy to calculate. But! • Any function can of course be approximated by a Fourier series. • But unless the function (i) has periodic boundary conditions and (ii) is everywhere analytic (=“really smooth” in layman’s language), the approximation is limited by the Gibbs phenomenon.
Gibbs ‘ringing’. Max order = 10
Gibbs ‘ringing’. Max order = 100
Basis sets: (ii) Chebyshev polynomials. From Press et al, “Numerical Recipes” • Note: • Standard notation • is Tn. • They are defined on • an interval [-1,1].
Basis sets: (ii) Chebyshev polynomials. • Recurrence relations: • Many ‘special’ functions have them, and they can be very useful aids for computation. • Care is needed to choose one which converges though! Once again, there is a difference between a neat formula on paper and a stable computer algorithm. • For Chebyshevs we can use the following algorithm to calculate Tn for as high n as we like: # First, transform x so its range becomes [-1,1]. T[0] = 1 T[1] = x for i in range(2,N): T[i] = 2.0*x*T[i-1] – T[i-2]
Chebyshevs don’t suffer from Gibbs! Max order = 10 Max order = 5!
Off-pixel-centre sources U-V ‘plane’ ‘Sky’ Fourier RED = real, BLUE = imaginary. Fourier
The next research interest: x-ray flashes in XMM data? • The standard XMM source detection deals with total counts. List of sources. • A simple null-hypothesis variability test is performed on all such sources, and any interesting ones will have already been picked over. • Q1: is a source which has its counts bunched in a short time easier to detect than one with counts spread out over the exposure duration? • A: seems reasonable, but we’ll do some figuring in a minute to check.
The next research interest: x-ray flashes in XMM data? • Q2: Would x-ray bursts have been picked up by other satellites? • A: The only others worth considering are RXTE and the BAT instrument on Swift. • Q3: Can we estimate how many candidates there might be? • Let’s do a logN-logS of the BAT detections, then extrapolate. • The other figures we need: • XMM-Newton has a FOV with ½ degree diameter; • It has been operating for 10 years.
Search for a typical GRB From P T O’Brien et al, astro-ph/0605230 Average duration ~ 30 s Average spectral index ~ 0.5
Q1 – which is easier to detect, a short or long burst? • Let’s do some simple modelling. Suppose we have N time bins, each of which contains a number of x-ray counts ci. These data will of course be Poisson randoms. The null hypothesis is that the parent light curve is just that of the background, which we’ll assume we know to be a constant value B counts per bin. • We want to compare two probabilities: • After summing the bin counts to get C, the probability P1 that C or higher would arise by random fluctuations about the null hypothesis value of N*B; • The probability P2 that B would produce (by random fluctuations) Cin at least one of the bins.
The battle of the probabilities - an example • Which is more likely to result by chance just from a constant background level? or Both give a total of five counts. Time Time
The battle of the probabilities • P1 is easy to calculate – it is just • Similarly, the probability of getting C or greater in a single bin is just • But it turns out that the probability of this happening in any of N bins is
The battle of the probabilities • Let’s take as typical figures: • Background rate = 5.0e-5 counts/s (roughly the lower limit for XMM, summed over all instruments, all bands). • Detection probability Pdet chosen to be exp(-8) (same as for 1XMM and 2XMM source catalogs). • Exposure duration 30ks (a typical XMM value). • Bin duration 30 s (a typical GRB burst duration). • Calculation shows that 6 counts are needed for P1<Pdet, but only 2 counts in any 10 second time bin for P2<Pdet. • So the answer to Q1 is YES it is a reasonable project to look for bursts not picked up by the standard pipeline source detection – at least, statistically speaking.
Q2 – have Rossi and Swift got the scoop? • Both Rossi (alias RXTE) and Swift have wide-area detectors. Their sensitivities are not all that high however: • Swift BAT: about 4e-9 erg cm-2 s-1. (Converted to XMM 0.3-12 keV band, assuming a typical GRB spectral index of +0.5.) • BAT detects about 0.3 GRB sr-1 day-1. • ASM on RXTE: 30 mCrab – works out in erg cm-2 s-1 to much worse than BAT. Forget it - RXTE is not in the running. • Compared to • XMM: about 1e-12 erg cm-2 s-1. • So it seems there is some territory to explore.
Q3 – how many to expect? 5 XMM: ~8e4 GRB sr-1 day-1. FOV = 6e-5 sr; expect 5 a day. This figure should be taken with a pinch of salt, but it is intriguing to say the least. 4 3 Log10(GRB rate) in GRB sr-1 day-1 Slope of 1.5 if evenly distributed in space 2 1 0 Swift BAT Log10(flux) in erg cm-2 s-1 -1 -12 -11 -10 -9 -8
How to go about it? • A variation on a technique described in J Scargle ApJ 504, 405 (1998) suggests itself. Scargle used a Bayesian analysis, but I am more interested in his model: • He compared model A which consisted of constant flux over the whole interval, with model B which cut the time series into two blocks, within each of which the flux was constant. Ie:
Comparison of two models: (Ignoring background B(t)) Model A: λ1 0 T Model B: λ2 λ3 0 T1 T
Likelihood ratio • The likelihood ratio between these models evaluates to (T1=NΔt and T=MΔt for bin duration Δt.) • The procedure would mimic Scargle’s: • Calculate U for all possible T1; • See how probable the maximum value is. • Have to figure in the PSF too... and worry about how well the background is known... and instrumental noise... and probably some other things too.
Haven’t made it work yet... ...but maybe some student will.