Download
1 / 4
40 likes | 115 Views
Clustering analysis of tumor samples (IBC 20, nIBC 20) normals excluded. Hierarchical clustering analysis was performed with 1000 most informative probes. A. B. T wo clusters were formed . cluster A -- many ER + cases (83%, 15 out of 18). cluster B -- many ER - cases (59%, 13 out of 22).

E N D
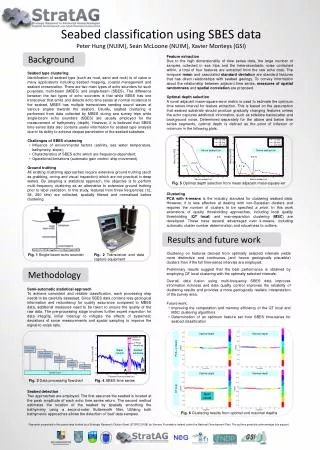
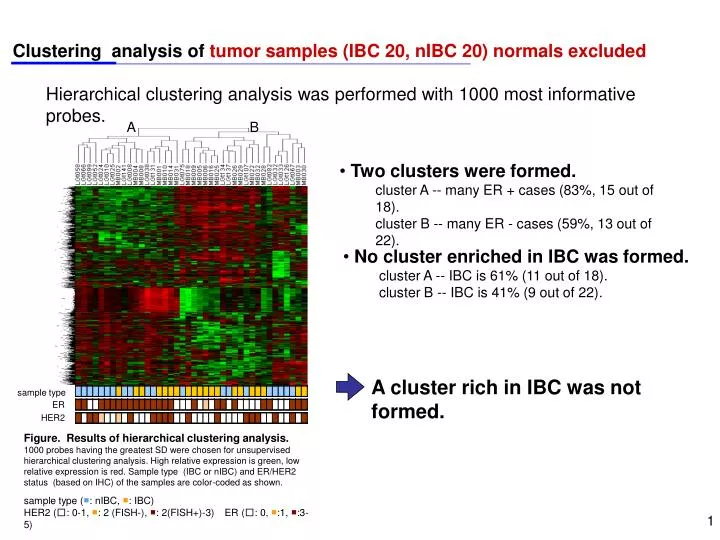
Clustering analysis of tumor samples (IBC 20, nIBC 20) normals excluded Hierarchical clustering analysis was performed with 1000 most informative probes. A B • Two clusters were formed. • cluster A -- many ER + cases (83%, 15 out of 18). • cluster B -- many ER - cases (59%, 13 out of 22). • No cluster enriched in IBC was formed. • cluster A -- IBC is 61% (11 out of 18). • cluster B -- IBC is 41% (9 out of 22). A cluster rich in IBC was not formed. sample type ER HER2 Figure. Results of hierarchical clustering analysis. 1000 probes having the greatest SD were chosen for unsupervised hierarchical clustering analysis. High relative expression is green, low relative expression is red. Sample type (IBC or nIBC) and ER/HER2 status (based on IHC) of the samples are color-coded as shown. sample type (■: nIBC, ■: IBC) HER2 (□: 0-1, ■: 2 (FISH-), ■: 2(FISH+)-3)ER (□: 0, ■:1, ■:3-5) 1
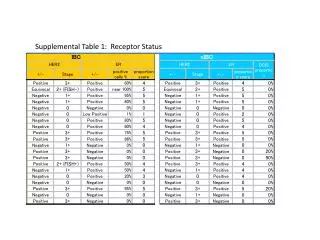
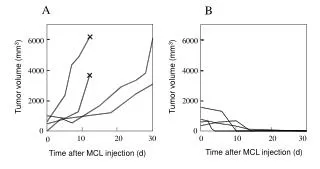
(1) ASSESSMENT OF IBC BY mRNA EXPRESSION Selection of the gene set for assessment of IBC 24 samples (IBC 12, non-IBC 12) were used as a learning set and the remaining16 samples were used as validation set <gene selection criteria> Gene A Gene B 1) differentially expressed genes nIBC nIBC IBC IBC Filtered by the following criteria: ・ fold change ≧ 2 6500 ・ t-test(non-paired)p-value < 0.05 ⇒ 779 genes were selected. 6050 4700 3800 2) lower false-negative/false-positive rates 2900 ・Determination of the positive threshold in each gene 2750 The value that gives the minimum of the sum of false-positives and false-negatives. 1000 1200 Gene A → 4700 Gene B → 2900 ・False-positive/negative are detected in two or less samples Gene A → false negative 5, false positive 0 → × exclude select Gene B → false negative 1, false positive 1 → ○ 132 genes were selected as the gene setfor assessment of IBC • 100 genes were expressed at higher levels in IBC. • 32 genes were expressed at lower levels in IBC.
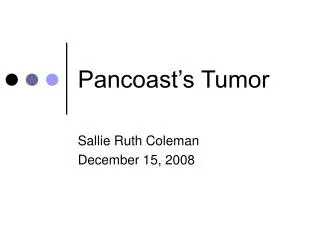
(1) ASSESSMENT OF IBC BY mRNA EXPRESSION sample type ER HER2 Clustering analysis of the learning set (IBC 12, nIBC 12) Hierarchical clustering analysis of the learning set was performed with 132 genes. A B • Two clusters were formed. • -- ER+ enriched cluster was not formed • cluster A -- ER+ ; 75% (9 out of 12) • cluster B -- ER+ ; 75% (9 out of 12) IBC>nIBC genes • A cluster enriched for IBC was formed. • cluster A -- nIBC cluster (nIBC ; 100%, 12 out of 12) • cluster B -- IBC cluster (IBC ; 100%, 12 out of 12) nIBC>IBC genes The learning set clustered according to sample type (IBC / nIBC). The selected 132 genes could discriminate IBC from non-IBC. Figure. Results of hierarchical clustering analysis. Unsupervised hierarchical clusteringwas performed using 132 genes. High relative expression is green, low relative expression is red. Sample type (IBC or nIBC) and ER/HER2 status (based on IHC) of the samples are color-coded as shown. sample type (■: nIBC, ■: IBC) HER2 (□: 0-1, ■: 2 (FISH-), ■: 2 (FISH+)-3)ER (□: 0, ■:1, ■:3-5)
(1) ASSESSMENT OF IBC BY mRNA EXPRESSION Evaluation of the IBC assessmentwith the learning set IBC-likeness was computed in each sample, and the IBC assessment was evaluated. IBC score: Index of IBC-likeness of a sample = The rate of the positive genes in each sample IBC-like ※ we defined ‘IBC score’ as an index of IBC-likeness 1) Positive/Negative was judged for every gene ・ IBC>nIBC genes → positive when higher than threshold IBC diagnostic criteria 43.0 IBC score ・ nIBC>IBC genes → positive when lower than threshold 2) The IBC score for each sample was determined by calculating the percentage of positive genes. nIBC-like nIBC IBC Figure. Distribution of the IBC score.The scores of the IBC group were higher and the two groups were completely separated. positive genes / 132(all genes) x 100 The learning set could be divided into IBC and nIBC by the IBC score. • IBC diagnostic criteria was set to 43.0