Download
1 / 27
270 likes | 387 Views
Immigration. Immigration. 1. Test Your Immigration Knowledge. What Percentage of the Population is Foreign Born?. A. 2.5% B. 8% C. 12.5% D. 25%. What is the U.S. Census Bureau’s Projection for the 2050 U.S. Population?. A.130 Million B. 420 Million C. 205 Million

E N D
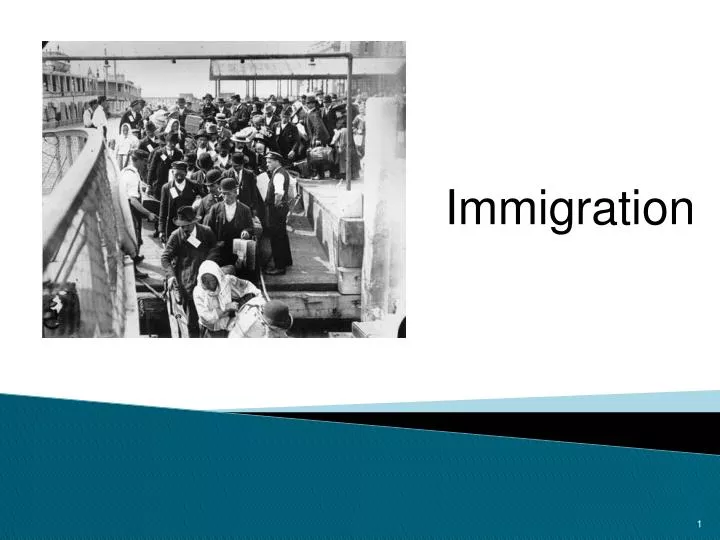
Immigration Immigration 1
What Percentage of the Population is Foreign Born? A. 2.5% B. 8% C. 12.5% D. 25%
What is the U.S. Census Bureau’s Projection for the 2050 U.S. Population? A.130 Million B. 420 Million C. 205 Million D. 429 Million
What Percentage of the Foreign-Born Population is from Mexico? A. 11% B. 27% C. 31% D. 8%
What Does Illegal Immigration Cost the American Taxpayer Each Year? A. No Cost B. $500 Million C. $2 Billion D. $36 Billion
How Many Illegal Aliens Are Currently in the U.S.? A. 1 million B. 22 million C. 18 million D. 13 million
How Many Immigrants Come to the U.S. Legally Each Year? A. Fewer than 250,000 B. 250,000 to 500,000 C. 500,000 to 750,000 D. More than one million
How Many Immigrants in the U.S. Lack Health Insurance? A. 25% B. 10% C. 2% D. Less than 1%
What is Used to Justify Birthright Citizenship? A. Declaration of Independence B. Bill of Rights C. 14th Amendment D. The Immigration and Naturalization Act of 1965
Approximately How Much of the U.S.-Mexican Border is Fenced? A. 2,000 miles B. 1,000 miles C. 370 miles D. There is no fence
Non-Citizens Are Counted in the U.S. Census? A.True B. False
Answers 1. C. 12.5% 2. B. 420 Million 3. C. 31% 4. D. 36 Billion 5. D. 13 Million 6. D. More than 1 Million 7. A. 25% 8. C. 14th Amendment 9. C. 370 Miles 10. True
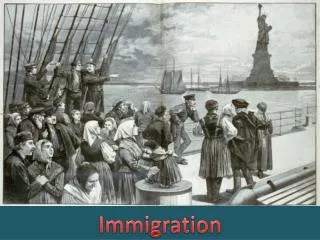
History • Immigration history can be viewed in 4 eras, 1.Colonial Period 2.Midnineteenth century 3.Turn of the 20th century 4.Post 1965 • The settling of America began with an idea. The idea was that people can join together and agree to govern themselves by making laws for the common good. With that idea in mind, 102 English colonists set sail in 1620 on the Mayflower. This is considered to be the start of European migration. • In 1638 the Swedes began their migration to America. They were an organized group of colonizers sent by the Swedish Government to establish a colony in Delaware. In 1655, the colony was lost to the Dutch. • During the colonial era most of the immigrants to the U.S. came from Northern Europe. Their numbers declined during the 1770s, but picked up during the mid 1800s. New arrivals came from several countries, but mostly from Germany and Ireland where crop failures caused many to leave their homelands. Other groups also arrived from the Netherlands, Spain, Italy, the Scandinavian countries, and Eastern Europe
Significant Historic Dates in U.S. Immigration • Naturalization Act of 1790: Stipulated that “Any alien, being a free white person, may be admitted to become a citizen of the United States." • 1875: Supreme Court declared that regulation of US immigration is the responsibility of the Federal Government. • 1891: The Federal Government assumed the task of inspecting, admitting, rejecting, and processing all immigrants seeking admission to the U.S. • 1892: On January 2, a new Federal US immigration station opened on Ellis Island in New York Harbor. • 1903: This Act restated the 1891 provisions concerning land borders and called for rules covering entry as well as inspection of aliens crossing the Mexican border. • 1907 The US immigration Act of 1907: Reorganized the states bordering Mexico into Mexican Border District to stem the flow of immigrants into the United States.
Significant Historic Dates in U.S. Immigration • 1924 Act: Reduced the number of US immigration visas and allocated them on the basis of national origin. • 1940 The Alien Registration Act: Required all aliens (non-U.S. citizens) within the United States to register with the Government and receive an Alien Registration Receipt Card (the predecessor of the "Green Card"). • 1950 Passage of the Internal Security Act: Rendered the Alien Registration Receipt Card even more valuable. Immigrants with legal status had their cards replaced with what generally became known as the "green card" . • 1986 Act: Focused on curtailing illegal US immigration. It legalized hundred of thousands of illegal immigrants. The 1986 Immigration Act is commonly know as the 1986 Immigration Amnesty. It also introduced the employer sanctions program which fines employers for hiring illegal workers. It also passed tough laws to prevent bogus marriage fraud. • USA Patriot Act 2001: Uniting and Strengthening America by providing appropriate tools required to intercept and obstruct terrorism.
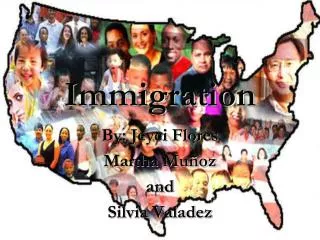
History continued • Most legal immigrants were male but in the 1990s women accounted for just over half of all legal immigrants, indicating a shift away from male dominated immigration of the past. • Contemporary immigrants tend to be younger then the native population of the US with people between ages of 15 and 34. • Immigrants are also more likely to be married now and less to be divorced then native born Americans of the same age.
Players • Republican views on Immigration • The Republican Party supports reforming the immigration system to ensure that it is legal, safe, orderly and humane. It also supports measures to ensure that the immigration system is structured to address the needs of national security. They often believe that many foreigners want to "invade" the US rather than become part of it. • Democratic views on Immigration • Democrats would like to see everyone on earth have their chance at life, liberty and the pursuit of freedom. Although Americans do come first in terms of the legal protections and rights that Democrats fight for, their views extend to people beyond the American borders as well. They want to give illegal immigrants a chance to prove their worth and become citizens in the land of the free.
Players continued • Interest groups: American Immigration Control Foundation • Claims to be non-partisan but has history of supporting republican amendments Federation for American Immigration Reform • Also describes itself as non-partisan but leans conservative American Civil Liberties Union (ACLU) & AFL-CIO • Tend to support immigration and democrats
Players continued …. • http://www.youtube.com/watch?v=pu_P0F_7SuA • Lou Dobbs, formerly of CNN, was a major proponent of anti-immigration legislation. • Sen. John McCain is one republican who has supported and pushed for immigration reform, including sponsoring a 2005 bill with the late Sen. Ted Kennedy.
Public Opinion • The gap between the public and the political elite over immigration has been growing. • Currently 60% of public feels that immigration is a large issue (6th on Foreign Policy issues) • However, only 14% of elite feel the same way (Immigration 26th on importance) • In 1998 the numbers were 55% to 18% respectively • This creates a political stalemate. Supporters of amnesty for immigration want something, but the strength of public opinion keeps legislatures from doing anything against what the public wants.
Public Opinion continued • The public has been changing opinion slightly over the past years about amnesty for illegal immigrants. • June 2006 • 52% supported reform • 44% opposed • April 2009 • 61% supported • 35% opposed • I very surprising finding is that although in the Southwest immigration by me a more predominant issue their opinions are consistent with the American publics.
Public Opinion continued... • Numbers by region... • South • 54% favor decrease in immigration • East • 51% • Midwest • 48% • West • 44% • There is a gap in Partisan response, but both have increased their percentages from a year ago. 61% of republicans want a decrease (up from 46%). Democrats are now up to 44%, as compared to 39% last year.
Works Cited • Public Opinion • CIS.org. Center for Immigration Studies, 2007. Web. 18 Nov. 2009. <www.CIS.org>. • National Immigration Forum. National Immigration Forum, 2009. Web. 18 Nov. 2009. <www.immigrationforum.org>. • Opportunity Agenda. Opportunity Agenda, 2008. Web. 18 Nov. 2009. <www.opportunityagenda.org>. • Dolliver, Mark. "Public Opinion Sours on Immigration." Adweek. 13 Aug. 2009. Web. 18 Nov. 2009. <www.adweek.com>.