Download
1 / 25
250 likes | 379 Views
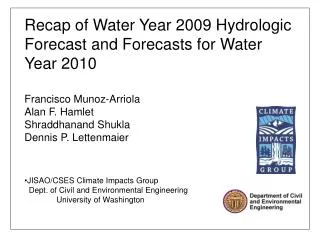
Recap of Water Year 2008 Hydrologic Forecast and Forecasts for Water Year 2009. Francisco Munoz-Arriola Alan F. Hamlet Shraddhanand Shukla Dennis P. Lettenmaier JISAO/CSES Climate Impacts Group Dept. of Civil and Environmental Engineering University of Washington. Recap of WY 2008.

E N D
Recap of Water Year 2008 Hydrologic Forecast and Forecasts for Water Year 2009 • Francisco Munoz-Arriola • Alan F. Hamlet • Shraddhanand Shukla • Dennis P. Lettenmaier • JISAO/CSES Climate Impacts Group • Dept. of Civil and Environmental Engineering • University of Washington
ECMRWF ENSO anomaly 2008 European Centre for Medium-Range Weather Forecasts
Validation Plot for 2008 Forecast (All Cool ENSO composite) Modified Flow (cfs)
Potential Implications of ENSO Transition States WY 2007 WY 2008
Historic Dalles Apr-Sept streamflow anomalies for water years with previous winter warm ENSO, current winter cool ENSO Stats: 12 of 13 above 0.39 11 of 13 above 0.49 9 of 13 above 0.88
Validation Plot for 2008 Forecast (All Warm to Cool ENSO composite) Modified Flow (cfs)
Potential Implications of ENSO Transition States WY 2007 WY 2008 WY 2009
ECMRWF ENSO anomaly 2009 0.2 -0.6 European Centre for Medium-Range Weather Forecasts http://www.ecmwf.int/products/forecasts/d/charts/seasonal/forecast/seasonal_range_forecast/nino_plumes_public_s3/
April-September Naturalized Flow for the Columbia River at The Dalles, OR from Historic Water Years vs January Nino 3.4 Anomalies. 1916-2002
April February March SWE and SM Simulated Climatological
February March April July August September SWE and SM Simulated Climatological
Ensemble Mean Climatological Mean Ensemble Members Climatological Extremes Based on Dalles Climatology 1901-2005 All Years
Ensemble Mean Climatological Mean Ensemble Members Climatological Extremes Based on Dalles Climatology 1901-2005 ENSO-Neutral Years
Ensemble Mean Climatological Mean Ensemble Members Climatological Extremes Based on Dalles Climatology 1901-2005 3.4 Range 2009 -0.6 to 0.2
Ensemble Mean Climatological Mean Ensemble Members Climatological Extremes ENSO-years Mean (N) West Wide Forecast (1961-2000) All Years
Ensemble Mean Climatological Mean Ensemble Members Climatological Extremes ENSO-years Mean (N) West Wide Forecast (1961-2000) ENSO-Neutral Years
Ensemble Mean Climatological Mean Ensemble Members Climatological Extremes ENSO-years Mean (N) West Wide Forecast (1961-2000) 3.4 Range 2009 -0.6 to 0.2
Conclusions: • . Cold ENSO conditions favored the prediction of wet conditions during the WY 2008. Flows above the average were observed late in the spring. Dry soil moisture conditions at the end of the winter and beginning of the spring evidenced the above average snow pack. • Neutral ENSO conditions are expected for the winter of 2008-2009, which will maintain streamflow levels around the climatological mean. • Current soil moisture conditions may contribute to slightly reduce streamflow generation during the Jan-June period by 3%. • Streamflow in hydropower-related stations and in all the stations forecasted for the Columbia River basin was within the average limits.
SWE and SM February March April Simulated Climatological