Download
1 / 42
420 likes | 558 Views
Advancements in Operational CMAQ MODIS AOD Data-Assimilation at Baron Advanced Meteorological Systems During Forecast Year 2013. John N. McHenry, Jeff Vukovich , Don Olerud , and W.T. Smith Baron Advanced Meteorological Systems. Review of the MODIS-DA Modeling Component

E N D
Advancements in Operational CMAQ MODIS AOD Data-Assimilation at Baron Advanced Meteorological Systems During Forecast Year 2013 John N. McHenry, Jeff Vukovich, Don Olerud, and W.T. Smith Baron Advanced Meteorological Systems
Review of the MODIS-DA Modeling Component • Review of Preliminary Real-Time Testing Results • Improvements: Assimilating Surface PM2.5 Observations • Initial Performance Analysis of Improved System • Up-coming Enhancements Outline of the Talk
The promise of chemical data assimilation: An Example No MODIS Assimilation MODIS Tau Assimilation Review of the MODIS-DA Modeling Component Day 1 Forecast Day 2 Forecast
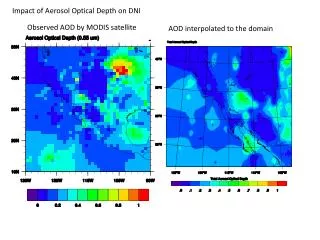
CMAQ-DA 2DVAR Algorithm Development • Partnering with the VISTA RPO, NCDENR and NASA, BAMS developed/tested/evaluated assimilation of MODIS AOD data into CMAQ V4.51 (soamods, CB4) using 2002 surface observations and annual run-results. • The software implements a 2-D Variational Data-Assimilation system that produces an optimal AOD “analysis” through statistical blending between background CMAQ AOD and observed MODIS AOD. • MODIS AOD is captured using both “Dark Target” and “Deep Blue” algorithms, the “Deep Blue” providing additional coverage over bright reflecting surfaces (Collection 5). Review of the MODIS-DA Modeling Component
Review of the MODIS-DA Modeling Component • Is the “forward operator” • Is the data-assimilation step (variational optimization) • Is the inverse operator
Review of Initial Real-Time Experimental Implementation and Testing Late-Fall; 19-day period after DA spin-up • In November 2012, BAMS implemented a real-time version of the system, running on the “EPA-36km” CONUS grid w/ 19-layers (identical to the VISTAS configuration) • The initial system was designed to produce real-time optimal AOD “analyses” using 2DVAR; but not forecasts. • The objective was to evaluate whether or not the analyses improve against “none-assimilated” vanilla cycling, starting with evaluation of total surface PM2.5.
Initial Real-Time Experimental Implementation and Testing Late-Fall; 19-day period after DA spin-up – December 10 • AirNow 24-hour average PM2.5 surface measurements as diamonds against CMAQ_DA 24-hr average (06z-06z) • Mexican biomass burn event • Improved areas circled blue • Degraded areas circled red
Initial Real-Time Experimental Implementation and Testing Late-Fall; 19-day period after DA spin-up – November 30 • AirNow 24-hour average PM2.5 surface measurements as diamonds against CMAQ_DA 24-hr average (06z-06z) • Improved areas circled blue • Degraded areas circled red
Initial Real-Time Experimental Implementation and Testing Late-Fall; 19-day period after DA spin-up Representative improvements in California (dust components probable) Glendora-Laurel site in LA county Anaheim
Initial Real-Time Experimental Implementation and Testing Representative improvements in Texas/Desert SW (biomass burning in Mexico) Late-Fall; 19-day period after DA spin-up Harris County TX Clark County Nevada Corpus Christi TX
Initial Real-Time Experimental Implementation and Testing Late-Fall; 19-day period after DA spin-up Representative improvements in Florida (modest biomass burning) Melbourne – Brevard County Dunn Ave – Volusia County
Initial Real-Time Experimental Implementation and Testing Late-Fall; 19-day period after DA spin-up: Time-series of performance statistics in the East 0.00 Bias line • Big improvement in skill first three days; little change in skill rest of period (clouds likely a big issue)
Initial Real-Time Experimental Implementation and Testing Late-Fall; 19-day period after DA spin-up: Time series of performance statistics in the West 0.00 Bias line • Major improvement in Bias throughout period • Larger Errors days 2-6 • Smaller Errors days 10-14
Initial Real-Time Experimental Implementation and Testing • Initial evaluation of 19-day late fall period against daily-average AirNow surface PM2.5 (TEOM) shows: • Significant improvement in the East first three days and little change later (clouds) • Much improved bias in West over entire period • Degraded error in the West days 2-6 • Modest improved error in the West days 10-14 • On going work reported at that time: • When it occurs, worsening of performance at the surface may result from not distinguishing aerosols aloft in MODIS: will be bringing in observed surface PM2.5 in upcoming scheme revision => FOCUS of this talk: impacts • Tuning of correlation length-scale in 2DVAR scheme may be needed (DONE) • A minor difference in AOD calculation between CMAQ and MODIS may be contributing some small unwanted bias in the final AOD “analysis.” We are looking at this. (UNNEEDED) • Plan to migrate to operational status in the late spring/early summer time frame. (DONE – Now running 1x daily 60-hour forecasts, 06Z Cycle)
Initial “Inverse Operator” Had only linear-scaling in the vertical to match the assimilated AOD result Improvements: Assimilating Surface PM2.5 Observations Once the Tau increment is known in each CMAQ vertical column, the non-linear revised-IMPROVE equations are iterated to recover the newly analyzed aerosol optical depth by adjusting the aerosol constituents: • For increasing Tau, all background accumulation or coarse mode aerosol species concentrations are adjusted upwards except: • Over the ocean: sulfates, nitrates, and chlorine • Near the coastline: sulfates • Inland: sulfates, sea-salts • For decreasing Tau, all accumulation and coarse mode species may be adjusted downward • Nothing is done to adjust modeled NO2, which is assumed “as good as can be” in the model due to its short life-time and relatively local nature • Further species discrimination in the iterated-inverse adjustment is made based on “smoke” versus “dust” categorizations available from MODIS
Revised “Inverse Operator” preferentially nudges concentrations in the vertical with different weights to match both the assimilated (final analyzed) total column AOD result *and* to ensure the surface PM2.5 values do not exceed the observations – when TAU increases due to the assimilation. Further, over the ocean, TAU increases always result in nudged model concentrations above the PBL only. Improvements: Assimilating Surface PM2.5 Observations • Analysis showed that when MODIS detected a higher AOD than the initial CMAQ estimate, the inversion-step back to model concentrations sometimes resulted in CMAQ surface PM2.5 that was “too hot”. This implied that relatively more of the increased concentration should be place above the PBL. • The revised inversion step makes use of surface PM2.5 to mitigate the above: modeled PBL heights are used to preferentially nudge model concentrations above the PBL more heavily such that the resulting modeled surface PM2.5 does not exceed the “gridded-observed” PM2.5. This is a first improvement – with more to come (discussed later).
Initial Performance Analysis of Improved System • CMAQ is being run in both “vanilla” mode (non-DA cycling and forecast) and “MODIS-DA” mode (cycling and forecast) using the newly implemented surface PM2.5 data • Runs began in late Spring and continued through Summer/Fall/Winter • Due to occasional MODIS outages and network glitches, the dataset is not continuous but features about 170 total model days for comparison • Preliminary analyses of both the final analysis (initial condition) and the day-1 and day-2 forecast results comparing “vanilla” and “MODIS-DA” were completed, with a focus on daily-average total surface PM2.5 observations as reported through the AIRNow “gateway” • Performance in six CONUS sub-regions and “warm” (87 days) versus “cold” (84 days) season has been looked at to-date.
Initial Performance Analysis of Improved System • NORTHEAST: Warm Season • NORTHEAST: Cool Season
Initial Performance Analysis of Improved System • SOUTHEAST: Warm Season • SOUTHEAST: Cool Season
Initial Performance Analysis of Improved System • NORTHCENTRAL: Warm Season • NORTHCENTRAL: Cool Season
Initial Performance Analysis of Improved System • SOUTHCENTRAL: Warm Season • SOUTHCENTRAL: Cool Season
Initial Performance Analysis of Improved System • NORTHWEST: Warm Season • NORTHWEST: Cool Season
Initial Performance Analysis of Improved System • SOUTHWEST: Warm Season • SOUTHWEST: Cool Season = MODIS assimilation improves = Vanilla Model Better
Initial Performance Analysis of Improved System Summary for 24-H Average “Initial Condition” Day
Initial Performance Analysis of Improved System (Forecast Day 1) • NORTHEAST: Warm Season • NORTHEAST: Cool Season
Initial Performance Analysis of Improved System (Forecast Day 1) • SOUTHEAST: Warm Season • SOUTHEAST: Cool Season
Initial Performance Analysis of Improved System (Forecast Day 1) • NORTHCENTRAL: Warm Season • NORTHCENTRAL: Cool Season
Initial Performance Analysis of Improved System (Forecast Day 1) • SOUTHCENTRAL: Warm Season • SOUTHCENTRAL: Cool Season
Initial Performance Analysis of Improved System (Forecast Day 1) • NORTHWEST: Warm Season • NORTHWEST: Cool Season
Initial Performance Analysis of Improved System (Forecast Day 1) • SOUTHWEST: Warm Season • SOUTHWEST: Cool Season = MODIS assimilation improves = Vanilla Model Better
Initial Performance Analysis of Improved System (Forecast Day 1) Summary for 24-H Average Day 1 Forecast (06z – 06z)
Initial Performance Analysis of Improved System (Forecast Day 2) • NORTHEAST: Warm Season • NORTHEAST: Cool Season
Initial Performance Analysis of Improved System (Forecast Day 2) • SOUTHEAST: Warm Season • SOUTHEAST: Cool Season
Initial Performance Analysis of Improved System (Forecast Day 2) • NORTHCENTRAL: Warm Season • NORTHCENTRAL: Cool Season
Initial Performance Analysis of Improved System (Forecast Day 2) • SOUTHCENTRAL: Warm Season • SOUTHCENTRAL: Cool Season
Initial Performance Analysis of Improved System (Forecast Day 2) • NORTHWEST: Warm Season • NORTHWEST: Cool Season
Initial Performance Analysis of Improved System (Forecast Day 2) • SOUTHWEST: Warm Season • SOUTHWEST: Cool Season = MODIS assimilation improves = Vanilla Model Better
Initial Performance Analysis of Improved System (Forecast Day 2) Summary for 24-H Average Day 2 Forecast (06z – 06z)
Overview of Forecast Lead-Time Results by Region/Season = Much Improves = Modest Improves = Very slight improves = Little Change = Very slight degrade = Modest Degrades = Much Degrades B: indicates the assimilated model worsened an already high bias
On the Horizon: Further improvements with the use of surface PM2.5 Observations • Current Revised “Inverse Operator” only considers the situation when the final analyzed TAU increases and surface PM 2.5 is “too hot” as a result of linear concentration re-scaling in the vertical. • Three more improvements are planned in the near future, each of which will conserve the final analyzed TAU (after assimilation step): Revisions are planned to be implemented and running by May 1, 2014 1) Tau Increases but surface PM2.5 is not high enough: preferentially increase concentrations within PBL while not nudging as much above PBL in order to better match surface PM2.5 2) Tau Decreases but surface PM2.5 is still too high: preferentially decrease concentrations more within PBL than above so as to better match the observed surface PM2.5 (Focus Here First) 3) Tau Decreases but surface PM2.5 is too low: preferentially decrease concentrations more above the PBL than within so as to better match the observed surface PM2.5
Conclusions • Initial Performance Analysis of the BAMS CMAQ-MODIS-DA analysis and forecast model for Warm and Cool Seasons by Six Sub-regions shows: • Very encouraging overall improvements, extending out to at least the 2nd forecast day in many regions • More consistent improvements during the warm season, when cloudiness is not as much of an issue • Impressive improvements in the SW US (all seasons) and South Central during the warm season • Some areas of concern – • NE US where vanilla performance is already very good • The Pacific NW warm season (clouds?) • Cool season in the central US (clouds?) • Analysis of regions/seasons that did degrade show that *increases* in an already high bias played a role in statistical degradation. Thus first order of business is to implement the additional vertically-sensitive improvements in the TAU-inversion step using real-time PM2.5 surface observations
Web: http://www.baronservices.com John N. McHenry, Chief Scientist Baron Advanced Meteorological Systems 1009 Capability Drive, Suite 312 Raleigh, NC 27606 Email: john.mchenry@baronams.com Phone: 919-839-2344 Contact Information