Download
1 / 54
540 likes | 592 Views
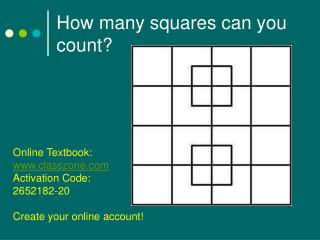
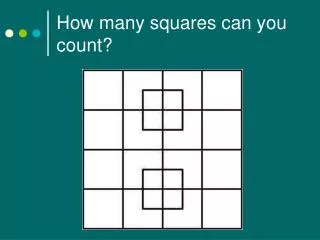
Describe 3 entirely different (but practical) ways for determining the area (in cm 2 ) of the darkened region below (design is on a piece of paper) to within 0.1%. Superimpose a finely-spaced grid over the figure and count squares.

E N D
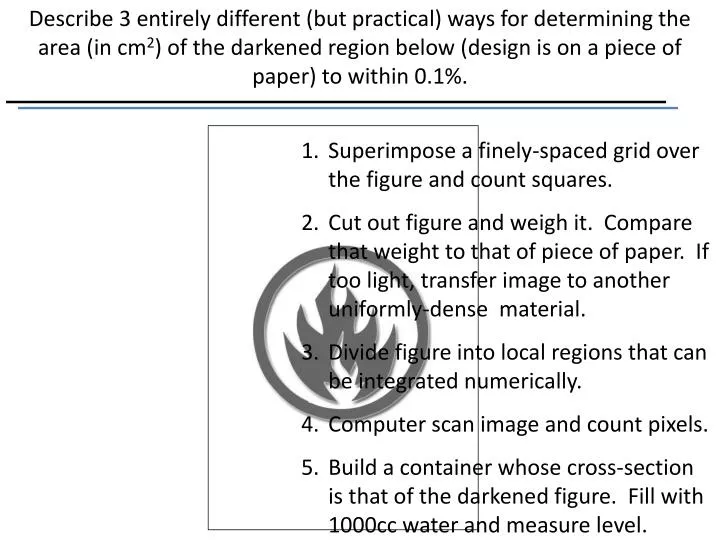
Describe 3 entirely different (but practical) ways for determining the area (in cm2) of the darkened region below (design is on a piece of paper) to within 0.1%. • Superimpose a finely-spaced grid over the figure and count squares. • Cut out figure and weigh it. Compare that weight to that of piece of paper. If too light, transfer image to another uniformly-dense material. • Divide figure into local regions that can be integrated numerically. • Computer scan image and count pixels. • Build a container whose cross-section is that of the darkened figure. Fill with 1000cc water and measure level.
Describe 3 entirely different (but practical) ways for determining the area (in cm2) of the darkened region below (design is on a piece of paper) to within 0.1%. • Use a “polar planimeter” – gadget that mechanically integrates the area defined by a close curve. • “Throw darts.” Draw rectangle (of calculable area) that encloses image. Pick random points within the rectangle and count which ones fall within the darkened figure. The ratio can be used to estimate area. (Monte Carlo Integration)
Error and Uncertainty Objectives Students will understand the significance of and be able to quantify the following: Significant Figures Accuracy, Precision, Error, Uncertainty Mean Values Average Deviation of the Mean Relative and % Uncertainty Precision of Computed Results
Source of Lecture Information • Bellevue College Science Division • No author or date noted • http://scidiv.bellevuecollege.edu/physics/measure&sigfigs/Measure&sigfigsintro.html
Significant Figures • Digits that are: • Actual Measured Values • Defined Numbers: • Unit conversions, e.g. 2.54 cm in one inch • Pi • e, base of natural logarithms • Integers, e.g. counting, what calendar year • Rational fractions, e.g. 2/5 • Computed Results using Significant Figures
Significant Figures • Digits that are the result of actual measurements • How many significant digits in each measurement taken with a meter stick? Three: 40.0 cm 41.2 cm 42.4 cm http://serc.carleton.edu/quantskills/methods/quantlit/DeepTime.html
Significant Figures • Be clear in your communication • Which is it? • 40 cm • 40.0 cm • 4 x 101 cm http://serc.carleton.edu/quantskills/methods/quantlit/DeepTime.html
Significant Figures • State the number of significant figures:
Significant Figures • State the number of significant figures for the number described in each phrase below:
Significant Figures • Rounding: If you do not round after a computation, you imply a greater accuracy than you actually measured • Determine how many digits you will keep • Look at the first rejected digit • If digit is less than 5, round down • If digit is more than 5, round up • If digit is 5, round up or down in order to leave an even number as your last significant figure
Significant Figures Rounding after math operations: • Multiplication or Division # of sig figs in result is equal to the # of sig figs in least accurate value used in the computation
Significant Figures Rounding after math operations: • Addition or Subtraction Place of last sig fig is important What’s the problem here?
Significant Figures Multiple Calculations • The least error will come from combining all terms algebraically, then computing all at once. • If you need to show intermediate steps to a reader, calculate sig figs at every step.
Accuracy vs. Precision • Accuracy refers to the agreement between a measurement and the true or accepted value • Cannot be discussed meaningfully unless the true value is known or knowable • The true value is not usually known (i.e. can never be known) • We generally have an estimate of the true value • Precision refers to the repeatability of measurement • Does not require us to know the true value
Accuracy vs. Precision • You are on the equator during the Spring Equinox (Mar 20) at midday (Sun is directly overhead) • Your watch reads 12:00pm • Is your watch accurate? • Is your watch precise? • How many significant figures does your watch communicate? Yes – measurement agrees with true value Don’t know – wait until sun overhead tomorrow 4; If you have a seconds hand, then 6 http://benkolstad.net/?p=2003
Accuracy vs. Precision • Rate the level of Accuracy and Precision as high/low
http://www.shmula.com/2092/precision-accuracy-measurement-systemhttp://www.shmula.com/2092/precision-accuracy-measurement-system
Accuracy vs. PrecisionRate the data precision and accuracy low or high Low Precision High Accuracy High Precision Low Accuracy Low Precision Low Accuracy
Error vs. Uncertainty • Error refers to the disagreement between a measurement and the true or accepted value In “real” science, it’s not very important (science studies new things where there are no true/accepted values) • Scientists design experiments and assume no error. Subsequent results may show error. • In school, we assume error and compare our results with the accepted values. • Don’t discuss error until a correct data analysis is done
Error vs. Uncertainty • Uncertainty is an interval around a value such that any repetition will produce a new result that lies within that interval. • Value + Uncertainty (e.g. L = 1.20 + 0.15 m, or L = 1.20 m + 0.15 m) • It is always possible to construct a completely certain sentence.
Situation: A class of students measures the length of a metal rod in centimeters. • Which group has the most accurate measurement? Don’t Know • Which group has the greatest error? Don’t Know • Which group has the most precise measurement? Group C • Which group has the greatest uncertainty? Group D
Update: The correct length of the rod is 10.160 cm • Which group has the least accurate measurement? Group C • Which group has the smallest error?Group A • Which group has the least precise measurement? Group D • Which group has the smallest uncertainty?Group C
Error • Error – difference between an observed/measured value and a true value. • We usually don’t know the true value • We usually do have an estimate • Systematic Errors • Faulty calibration, incorrect use of instrument • User bias • Change in conditions – e.g., temperature rise • Random Errors • Statistical variation • Small errors of measurement • Mechanical vibrations in apparatus
Accuracy and Estimation • Which type of error, systematic or random? Low Error Random Random Systematic
Error vs. Uncertainty Accuracy vs. Precision
Error • Percent Error • Relative Error
Estimating and Accuracy • Measurements often don’t fit the gradations of scales • Two options: • Estimate with a single reading • Independently measure several times and take an average http://scidiv.bellevuecollege.edu/physics/measure&sigfigs/C-Uncert-Estimate.html
Estimating and Accuracy • Simplest estimate, and common practice, is to assign ½ the most precise value on the scale: 3.5 + 0.5mm http://scidiv.bellevuecollege.edu/physics/measure&sigfigs/C-Uncert-Estimate.html
Precision of the Device • Some differences are always a part of any manufacturing process. • The uncertainty is assumed to be ½ the smallest scale division shown on the device. • This assumed uncertainty should be the case over the entire length of the device. • Unless the manufacturer provides the precision http://scidiv.bellevuecollege.edu/physics/measure&sigfigs/C-Uncert-Estimate.html
Make Multiple Measurements • Highly recommended when concerned with accuracy of results • Uncertainty is estimated using average deviation • Try to make each trial independent of the previous trial – different ruler, different observer, etc.
Mean and Avg. Deviation • When taking the mean of multiple measurements, the value for the mean should have 1 more sig fig than in the original observations
Mean and Avg. Deviation • Average Deviation is always rounded to one sig fig. • Mean can be subsequently be adjusted to contain appropriate # sig figs.
Mean and Avg. Deviation • Report the measurements below with the uncertainty that should be reported:
Uncertainty – Abs, Rel, % • Absolute Uncertainty – uncertainty in value • Relative Uncertainty – ratio of uncertainty to value • Percent Uncertainty – relative uncertainty x 100% 1 sig fig 2 sig figs 2 sig figs
Uncertainty – Abs, Rel, % • Determine the relative uncertainty for each of the measurements below (2 sig figs in rel/% uncertainty):
Uncertainty – Abs, Rel, % • Determine the absolute uncertainty for each of the measurements below (1 sig fig in uncertainty):
Calculators and significant digits: Let the uncertain digit determine the precision to which you quote a result Calculator: 12.6892 Estimated Error: +/- 0.07 Quote: 12.69 +/- 0.07
What is an error? • In data analysis, engineers use • error = uncertainty • error ≠ mistake. • Mistakes in calculation and measurements should always be corrected before calculating experimental error. • Measured value of x = xbestx • xbest = best estimate or measurement of x • x = uncertainty or error in the measurements
All measurements have errors • What are some sources of measurement errors? • Instrument uncertainty (caliper vs. ruler) • Use half the smallest division. • Measurement error (using an instrument incorrectly) • Measure your height - not hold ruler level. • Variations in the size of the object (spaghetti is bumpy) • Statistical uncertainty L = 9 ± 0.5 cm L = 8.5 ± 0.3 cm L = 11.8 ± 0.1 cm
If no error is given, assume half the last significant figure. • That's why you don't write 25.367941 mm.
How do you account for errors in calculations? • The way you combine errors depends on the math function • added or subtracted • multiplied or divide • other functions • The sum of two lengths is Leq = L1 + L2. What is error in Leq? • The area is of a room is A = L x W. What is error in A? • A simple error calculation gives the largest probable error.
Sum or difference • What is the error if you add or subtract numbers? • The absolute error is the sum of the absolute errors.
What is the error in length of molding to put around a room? • L1 = 5.0cm 0.5cm and L2 = 6.0cm 0.3cm. • The perimeter is • The error (upper bound) is:
Errors can be large when you subtract similar values. • Weight of container = 30 ± 5 g • Weight of container plus nuts = 35 ± 5 g • Weight of nuts?
What is the error in the area of a room? • L = 5.0cm 0.5cm and W = 6.0cm 0.3cm. • What is the relative error? • What is the absolute error? Board Derivation
Product or quotient • What is error if you multiply or divide? • The relative error is the sum of the relative errors.
Multiply by constant • What if you multiply a variable x by a constant B? • The error is the constant times the absolute error.
What is the error in the circumference of a circle? • C = 2 π R • For R = 2.15 ± 0.08 cm • C = 2 π (0.08 cm) = 0.50 cm