Download
1 / 5
50 likes | 206 Views
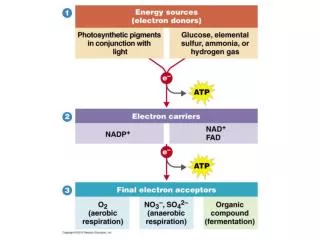
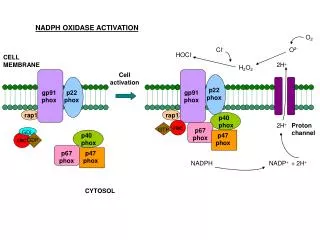
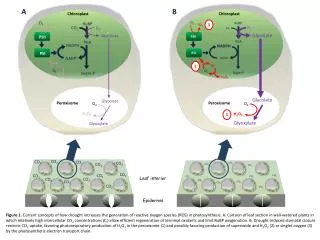
A. B. Chloroplast. Chloroplast. 1. 3. 2. O 2. RuBP. 1 O 2. O 2. RuBP. O 2. 1 O 2. CO 2. CO 2. O 2. Glycolate. PSII. Glycolate. PSII. PGA. PGA. NADPH. NADPH. PSI. PSI. NADP +. NADP +. O 2. O 2. O 2. Sugar -P. O 2. Sugar -P. H 2 O 2. H 2 O 2. Glycolate.

E N D
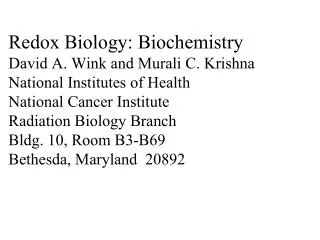
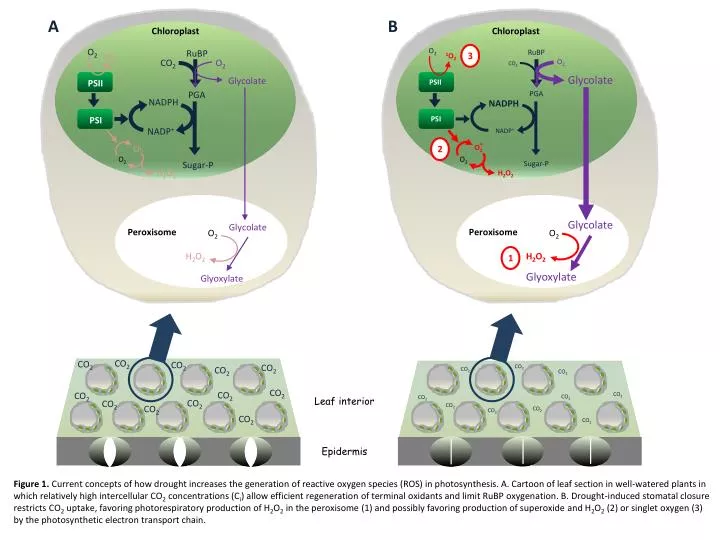
A B Chloroplast Chloroplast 1 3 2 O2 RuBP 1O2 O2 RuBP O2 1O2 CO2 CO2 O2 Glycolate PSII Glycolate PSII PGA PGA NADPH NADPH PSI PSI NADP+ NADP+ . O2 . O2 O2 Sugar-P O2 Sugar-P H2O2 H2O2 Glycolate Peroxisome O2 Glycolate Peroxisome O2 H2O2 H2O2 Glyoxylate Glyoxylate CO2 CO2 CO2 CO2 CO2 CO2 CO2 CO2 CO2 CO2 Leafinterior CO2 CO2 CO2 CO2 CO2 CO2 CO2 CO2 CO2 CO2 CO2 CO2 Epidermis Figure 1.Current concepts of how drought increases the generation of reactive oxygen species (ROS) in photosynthesis. A. Cartoon of leaf section in well-watered plants in which relatively high intercellular CO2 concentrations (Ci) allow efficient regeneration of terminal oxidants and limit RuBP oxygenation. B. Drought-induced stomatal closure restricts CO2 uptake, favoring photorespiratory production of H2O2 in the peroxisome (1) and possibly favoring production of superoxide and H2O2 (2) or singlet oxygen (3) by the photosynthetic electron transport chain.
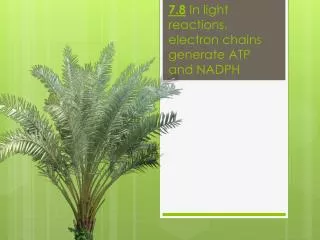
Plasma Membrane APOPLAST CYTOSOL H2O2 NADPH O2 Class III peroxidase Amine oxidase Polyamine oxidase NADPH oxidase Oxalate oxidase Superoxide dismutase Superoxide dismutase NADP+ Flavocytochrome Mn Heme FAD Cu CuZn CuZn H2O2 O2 e- O2 O2 - - O2. O2. Putrescine Cadaverine H2O2 Spermidine Spermine H2O2 O2 H2O2 Oxalate Figure 2.Multiple ROS-producing enzymes at the cell surface/exterior. Enzymes are shown in blue and their redox cofactors are indicated in yellow. Class III peroxidases may accept electrons from several types of compound to generate superoxide, but in many cases their physiological reductant is not established (reviewed by O’Brien et al., 2012).
Figure 3. The 15 of the 302 redox-linked genes that respond > 2-fold in the same direction in both drought 1 and drought 2 datasets and their response in related conditions. Data extracted from Genevestigator are shown as log2 values compared to controls. Red and green indicate induction and repression.Genes are orderedfrom top according to the number of conditions in whichtheyrespond. The full list of genes and their expression values are given in Supplemental Table S1. For details of experiments, see Supplemental Table S2.
Thiol-independentperoxidemetabolism Antioxidative systemsparticipate in signaling by theireffects on peroxidelevels Thiol-dependentperoxidemetabolism Signaling isalso possible through antioxidative activity per se ROH ROH ROOH ROOH ROH ROOH 2 H2O 2 H2O H2O2 H2O2 2CPRX 2CPRX 2CPRX NTR/TRX NTR/TRX PRXII GRX PRXII GRX PRXII MDHAR APX DHAR CAT GST SH SH SOH SH SH SOH SH SH GSH GSSG ASC DHA + GSH H2O2 ASC O2 MDHA S S SH GSS NAD(P)H GSH GSSG NAD(P)+ SH SH SH SH GSS S S SH GSH GSSG Dismutation by catalase APX functioningindependently of glutathione Ascorbate-glutathionepathway GST glutathioneperoxidasefunction Glutathione-linkedperoxiredoxin Thioredoxin-linkedperoxiredoxin Figure 4.Peroxide-removing enzymes: roles as antioxidants, in signaling, or both? Cartoon of the best characterized peroxide-metabolizing enzymes in plants. Other mechanisms are possible and for ease of display reactions are not shown stoichiometrically. APX, ascorbate peroxidase. CAT, catalase. DHAR, dehydroascorbate reductase. GRX, glutaredoxin. GST, glutathione S-transferase. MDHAR, monodehydroascorbatereductase. NTR, NADPH-thioredoxin C. PRXII, type II peroxiredoxin. 2CPRX, 2-cys PRX. TRX, thioredoxin.
A B 66 272 37 Total number of drought-induced genes = 375 C - Paraquat: O2, H2O2 (chloroplast) flu: singlet O2 (chloroplast) ABA 246 375 317 129 0 58 External H2O2 (extracellular) Paraquat: O2-, H2O2 (chloroplast) flu: singlet O2 (chloroplast) cat2: H2O2 (peroxisome) DROUGHT 1 DROUGHT 2 ABA cat2: High CO2 cat2: high CO2 (negative control) cat2: H2O2 (peroxisome) External H2O2 (extracellular) Oxidative stress marker transcripts (log2 treated/control) 360 354 372 15 21 3 Figure 5. Analysis of drought-inducible gene expression in responses to redox perturbation. A. Heatmap of drought-induced genes extracted from Genevestigator and the response of these genes to ABA or oxidative stress (top), and histogram showing expression of oxidative stress marker genes after the different treatments (bottom). Data are shown as log2 values compared to Col-0 (wild-type or untreated). Experimental details are given in Supplemental Table S2. Red and green on the heatmap indicate induction and repression according to the color scale shown at the top. The five genes for which data are shown in the bottom histogram are (left to right) APX1, GSTU24, UGT75B1,UGT73B5, and GPX6 (for values, see Supplemental Table S3B). B. Overlap of induced genes (cut-off 2-fold) in the two drought experiments. 375 genes were induced >2-fold in at least one of the experiments (Supplemental Table S3A). C. Number of these 375 genes that were induced > 2-fold by the different oxidative stresses (indicated in red circles within the outer blue circles).