Download
1 / 19
210 likes | 282 Views
Lecture # 5 PROPERTY TABLES(cont.). During a vaporization process, a substance exists as part liquid and part vapor. That is, it is a mixture of saturated liquid and saturated vapor (Fig. 1. 4). Saturated Liquid–Vapor Mixture. FIGURE 1- 4

E N D
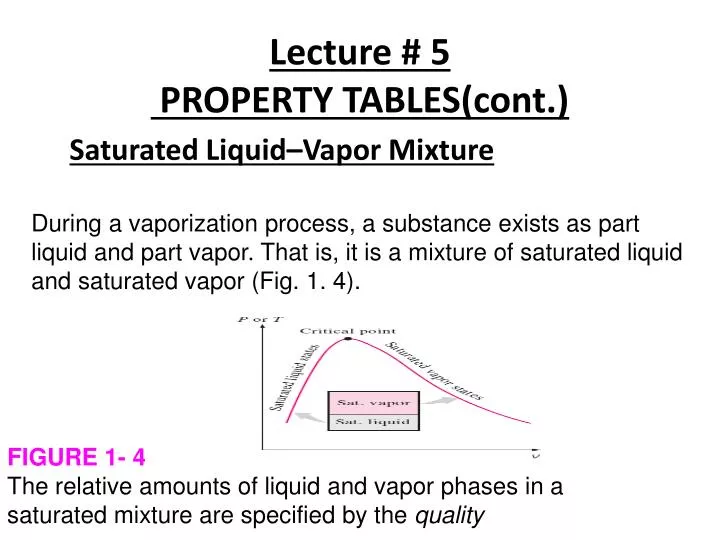
Lecture # 5 PROPERTY TABLES(cont.) During a vaporization process, a substance exists as part liquid and part vapor. That is, it is a mixture of saturated liquid and saturated vapor (Fig. 1. 4). Saturated Liquid–Vapor Mixture FIGURE 1- 4 The relative amounts of liquid and vapor phases in a saturated mixture are specified by the quality
Saturated Liquid–Vapor Mixture During a vaporization process, a substance exists as part liquid and part vapor. That is, it is a mixture of saturated liquid and saturated vapor (Fig. 1. 4). FIGURE 1- 4 The relative amounts of liquid and vapor phases in a saturated mixture are specified by the quality
To analyze this mixture properly, we need to know the proportions of the liquid and vapor phases in the mixture. This is done by defining a new property called the quality x as the ratio of the mass of vapor to the total mass of the mixture. Where:
The analysis given above can be repeated for internal energy and enthalpy with the following results: where y is v, u, or h. The subscript “avg” (for “average”) is usually dropped for simplicity. The values of the average properties of the mixtures are always between the values of the saturated liquid and the saturated vapor properties. That is,
EXAMPLE 1-4 An 80-L vessel contains 4 kg of refrigerant-134aat a pressure of 160 kPa. Determine (a) the temperature, (b) the quality, (c) the enthalpy of the refrigerant, and (d) the volume occupied by the vapor phase. Solution A vessel is filled with refrigerant-134a. Some properties of the refrigerant are to be determined. we can determine the specific volume as follows: At 160 kPa, we also read vf = 0.000687 m3/kg (Table A- 12) vg = 0.1031 m3/kg
Obviously, vf >v > vg, and, the refrigerant is in the saturated mixture region. Thus, the temperature must be the saturation temperature at the specified pressure: T =Tsat @ 160 kPa = -18.49 ͦC (b) Quality can be determined from (c) At 160 kPa, we also read from Table A–12 that hf= 19.18 kJ/kg and hfg= 160.23 kJ/kg. Then, h = hf+xhfg = 19.18 (kJ/kg) + 0.189 (160.23 kJ/kg) = 49.46 kJ/kg
(d) The mass of the vapor is mg = xmt = (0.1886) (4 kg) = 0.7544 kg and the volume occupied by the vapor phase is Vg = mg vg = (0.7544 kg) (0.1031 m3/kg) = 0.0778 m3 The rest of the volume is occupied by the liquid. Property tables are also available for saturated solid– vapor mixtures. Properties of saturated ice–water vapor mixtures, for example, are listed in Table A–8. Saturated solid–vapor mixtures can be handled just as saturated liquid–vapor mixtures
Superheated Vapor: • In the region to the right of the saturated vapor line and at temperatures above the critical point temperature, a substance exists as superheated vapor. • In these tables, the properties are listed against temperature for selected pressures starting with the saturated vapor data. • The saturation temperature is given in parentheses following the pressure value.
Compared to saturated vapor, superheated vapor is characterized by Lower pressures (P˂Psat at a given T ) • Higher temperatures (T ˃ Tsat at a given P) • Higher specific volumes (v ˃ vgat a given P or T) • Higher internal energies (u ˃ ugat a given P or T) • Higher enthalpies (h ˃ hgat a given P or T)
EXAMPLE Determine the internal energy of water at 20 psia and 400°F. • SolutionThe internal energy of water at a specified state is to be determined. • AnalysisAt 20 psia, the saturation temperature is 227.96°F. Since T ˃ Tsat, the water is in the superheated vapor region. Then the internal energy at the given temperature and pressure is determined from the superheated vapor table (Table A–6E) to be u=1145.1 Btu/lbm
Example: Determine the temperature of water at a state of P 0.5 MPa and h =2890 kJ/kg. Solution: The temperature of water at a specified state is to be determined.
Analysis At 0.5 MPa, the enthalpy of saturated water vapor is hg = 2748.7 kJ/kg. Since h ˃hg, as shown in the figure, we again have superheated • vapor. Under 0.5 MPa in Table A–6 we readObviously, the temperature is between 200 and 250°C. By linear interpolation it is determined to be • T = 216.3°C
Compressed Liquid • Compressed liquid tables are not as commonly available, and Table A–7 is the only compressed liquid table in this text. • The format of Table A–7 is very much like the format of the superheated vapor tables. • In the absence of compressed liquid data, a general approximation is to treat compressed liquid as saturated liquid at the given temperature. This is because the compressed liquid properties depend on temperature much more strongly than they do on pressure.
EXAMPLE Determine the internal energy of compressed liquid water at 80°C and 5 MPa, using (a) data from the compressed liquid table and (b) saturated liquid data. What is the error involved in the second case? Solution The exact and approximate values of the internal energy of liquid water are to be determined Analysis At 80°C, the saturation pressure of water is 47.416 kPa, and since 5 MPa >| Psat, we obviously have compressed liquid, as shown in the Figure. (a) From the compressed liquid table (Table A–7) At P = 5 MPa, T = 80ͦC u = 333.72 kJ/kg (b) From the saturation table (Table A–4), we read u ≈ uf@80ͦ C = 334.86 kJ/kg The error involved is