Download
1 / 1
10 likes | 76 Views
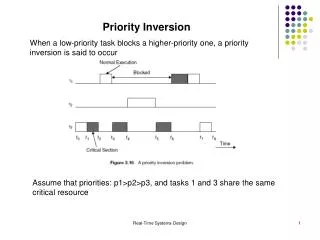
TOXICITY MODELLING OF “EEC PRIORITY LIST 1” COMPOUNDS. 2s/P003. F. Consolaro and P. Gramatica QSAR Research Unit, Dept. of Structural and Functional Biology, University of Insubria, Varese, Italy. E-mail: fedec@imiucca.csi.unimi.it Web-site: http://andromeda.varbio.unimi.it/~QSAR/.

E N D
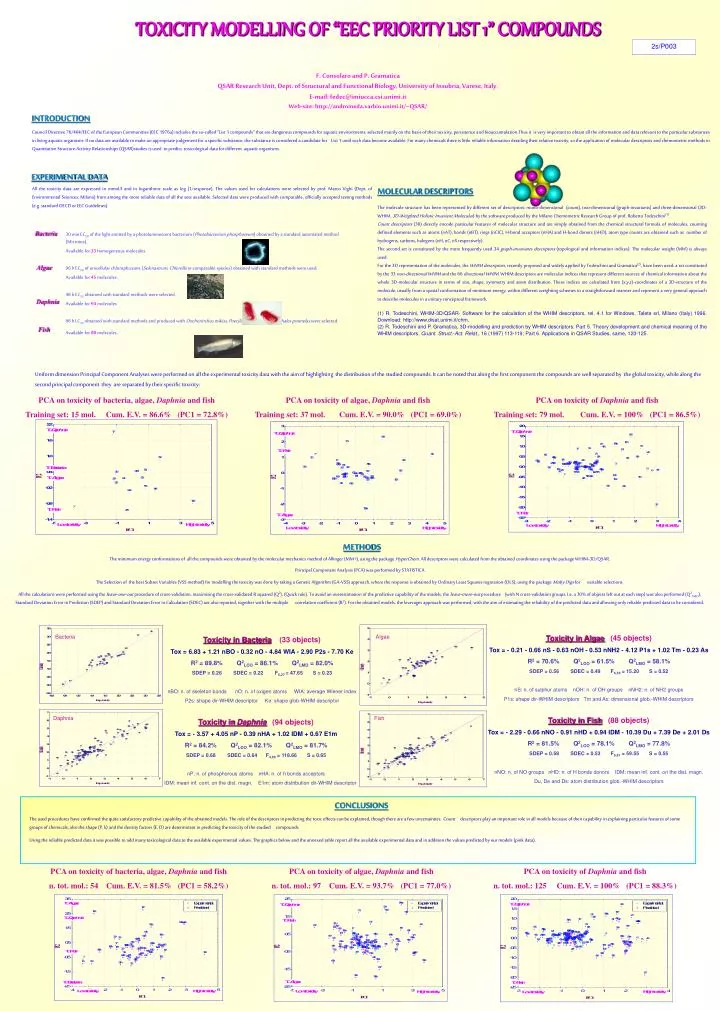
TOXICITY MODELLING OF “EEC PRIORITY LIST 1” COMPOUNDS 2s/P003 F. Consolaro and P. Gramatica QSAR Research Unit, Dept. of Structural and Functional Biology, University of Insubria, Varese, Italy. E-mail: fedec@imiucca.csi.unimi.it Web-site: http://andromeda.varbio.unimi.it/~QSAR/ INTRODUCTION Council Directive 76/464/EEC of the European Communities (EEC 1976a) includes the so-called “List 1 compounds” that are dangerous compounds for aquatic environments, selected mainly on the basis of their toxicity, persistence and bioaccumulation.Thus it is very important to obtain all the information and data relevant to the particular substances in living aquatic organisms. If no data are available to make an appropriate judgement for a specific substance, the substance is considered a candidate for List 1 until such data become available. For many chemicals there is little reliable information detailing their relative toxicity, so the application of molecular descriptors and chemometric methods in Quantitative Structure-Activity Relationships (QSAR)studies is used to predict toxicological data for different aquatic organisms. EXPERIMENTAL DATA All the toxicity data are expressed in mmol/l and in logarithmic scale as log (1/response). The values used for calculations were selected by prof. Marco Vighi (Dept. of Environmental Sciences, Milano) from among the more reliable data of all the sets available. Selected data were produced with comparable, officially accepted testing methods (e.g. standard OECD or EEC Guidelines). MOLECULAR DESCRIPTORS The molecule structure has been represented by different set of descriptors: mono-dimensional (count), two-dimensional (graph-invariants) and three-dimensional (3D-WHIM, 3D-Weighted Holistic Invariant Molecular) by the software produced by the Milano Chemometric Research Group of prof. Roberto Todeschini(1). Count descriptors (38) directly encode particular features of molecular structure and are simply obtained from the chemical structural formula of molecules, counting defined elements such as atoms (nAT), bonds (nBT), rings (nCIC), H-bond acceptors (nHA) and H-bond donors (nHD); atom type counts are obtained such as number of hydrogens, carbons, halogens (nH, nC, nX respectively). The second set is constituted by the more frequently used 34graph-invariants descriptors (topological andinformation indices). The molecular weight (MW) is always used. For the 3D representation of the molecules, the WHIM descriptors, recently proposed and widely applied by Todeschini and Gramatica(2), have been used: a set constituted by the 33 non-directional WHIM and the 66 directional WHIM. WHIM descriptors are molecular indices that represent different sources of chemical information about the whole 3D-molecular structure in terms of size, shape, symmetry and atom distribution. These indices are calculated from (x,y,z)-coordinates of a 3D-structure of the molecule, usually from a spatial conformation of minimum energy, within different weighting schemes in a straightforward manner and represent a very general approach to describe molecules in a unitary conceptual framework. (1) R. Todeschini, WHIM-3D/QSAR- Software for the calculation of the WHIM descriptors, rel. 4.1 for Windows, Talete srl, Milano (Italy) 1996. Download: http://www.disat.unimi.it/chm. (2) R. Todeschini and P. Gramatica, 3D-modelling and prediction by WHIM descriptors. Part 5. Theory development and chemical meaning of the WHIM descriptors, Quant. Struct.-Act. Relat., 16 (1997) 113-119; Part 6. Applications in QSAR Studies, same, 120-125. Bacteria 30 min EC50 of the light emitted by a photoluminescent bacterium (Photobacterium phosphoreum) obtained by a standard automated method (Microtox). Available for33 homogeneous molecules. 96 h EC50 of unicellular chlorophiceans (Selenastrum, Chlorella or comparable species) obtained with standard methods were used. Available for 45 molecules. 48 h EC50 obtained with standard methods were selected. Available for 94 molecules. 96 h LC50 obtained with standard methods and produced with Onchorinchus mikiss, Poecilia reticulata or Pimephales promelas were selected. Available for 88 molecules. Algae Daphnia Fish Uniform dimension Principal Component Analyses were performed on all the experimental toxicity data with the aim of highlighting the distribution of the studied compounds. It can be noted that along the first component the compounds are well separated by the global toxicity, while along the second principal component they are separated by their specific toxicity: PCA on toxicity of bacteria, algae, Daphnia and fish Training set: 15 mol. Cum. E.V. = 86.6% (PC1 = 72.8%) PCA on toxicity of algae, Daphnia and fish Training set: 37 mol. Cum. E.V. = 90.0% (PC1 = 69.0%) PCA on toxicity of Daphnia and fish Training set: 79 mol. Cum. E.V. = 100% (PC1 = 86.5%) The minimum energy conformations of all the compounds were obtained by the molecular mechanics method of Allinger (MM+), using the package HyperChem. All descriptors were calculated from the obtained coordinates using the package WHIM-3D/QSAR. Principal Component Analysis (PCA) was performed by STATISTICA. The Selection of the best Subset Variables (VSS method) for modelling the toxicity was done by taking a Genetic Algorithm (GA-VSS) approach, where the response is obtained by Ordinary Least Squares regression (OLS), using the package Moby Digs for variable selections. All the calculations were performed using the leave-one-out procedure of cross-validation, maximising the cross-validated R squared (Q2), (Quick rule). To avoid an overestimation of the predictive capability of the models, the leave-more-out procedure (with N cross-validation groups, I.e. a 30% of objects left out at each step) was also performed (Q2LMO). Standard Deviation Error in Prediction (SDEP) and Standard Deviation Error in Calculation (SDEC) are also reported, together with the multiple correlation coefficient (R2). For the obtained models, the leverages approach was performed, with the aim of estimating the reliability of the predicted data and allowing only reliable predicted data to be considered. METHODS Bacteria Algae Toxicity in Algae(45 objects) Tox = - 0.21 - 0.66 nS - 0.63 nOH - 0.53 nNH2 - 4.12 P1s + 1.02 Tm - 0.23 As R2 = 70.6% Q2LOO = 61.5% Q2LMO = 58.1% SDEP = 0.56 SDEC = 0.49 F6,38 = 15.20 S = 0.52 nS: n. of sulphur atoms nOH: n. of OH groups nNH2: n. of NH2 groups P1s: shape dir-WHIM descriptors Tm and As: dimensional glob.-WHIM descriptors Toxicity in Bacteria(33 objects) Tox = 6.83 + 1.21 nBO - 0.32 nO - 4.84 WIA - 2.90 P2s - 7.70 Ke R2 = 89.8% Q2LOO = 86.1% Q2LMO = 82.0% SDEP = 0.26 SDEC = 0.22 F5,27 = 47.65 S = 0.23 nBO: n. of skeleton bonds nO: n. of oxigen atoms WIA: average Wiener index P2s: shape dir-WHIM descriptor Ke: shape glob-WHIM descriptor Fish Daphnia Toxicity in Fish (88 objects) Tox = - 2.29 - 0.66 nNO - 0.91 nHD + 0.94 IDM - 10.39 Du + 7.39 De + 2.01 Ds R2 = 81.5% Q2LOO = 78.1% Q2LMO = 77.8% SDEP = 0.58 SDEC = 0.53 F6,81 = 59.55 S = 0.55 nNO: n. of NO groups nHD: n. of H bonds donors IDM: mean inf. cont. on the dist. magn. Du, De and Ds: atom distribution glob.-WHIM descriptors Toxicity in Daphnia (94 objects) Tox = - 3.57 + 4.05 nP - 0.39 nHA + 1.02 IDM + 0.67 E1m R2 = 84.2% Q2LOO = 82.1% Q2LMO = 81.7% SDEP = 0.68 SDEC = 0.64 F4,89 = 118.66 S = 0.65 nP: n. of phosphorous atoms nHA: n. of h bonds acceptors IDM: mean inf. cont. on the dist. magn. E1m: atom distribution dir-WHIM descriptor CONCLUSIONS The used procedures have confirmed the quite satisfactory predictive capability of the obtained models. The role of the descriptors in predicting the toxic effects can be explained, though there are a few uncertainties. Count descriptors play an important role in all models because of their capability in explaining particular features of some groups of chemicals; also the shape (P, k) and the density factors (E, D) are determinant in predicting the toxicity of the studied compounds. Using the reliable predicted data it was possible to add many toxicological data to the available experimental values. The graphics below and the annexed table report all the available experimental data and in addition the values predicted by our models (pink data). PCA on toxicity of bacteria, algae, Daphnia and fish n. tot. mol.: 54 Cum. E.V. = 81.5% (PC1 = 58.2%) PCA on toxicity of algae, Daphnia and fish n. tot. mol.: 97 Cum. E.V. = 93.7% (PC1 = 77.0%) PCA on toxicity of Daphnia and fish n. tot. mol.: 125 Cum. E.V. = 100% (PC1 = 88.3%)