Download
1 / 10
100 likes | 227 Views
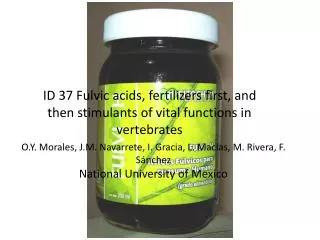
Fulvic acids oxidation and biodegradability. Ivan Kozyatnyk a * , Joanna Świetlik c , Ursula Raczyk-Stanisławiak c , Nataliya Klymenko b , Jacek Nawrocki c a Umeå University, Department of Chemistry e-mail:ivan.kozyatnyk@chem.umu.se

E N D
Fulvic acids oxidation and biodegradability Ivan Kozyatnyka*, Joanna Świetlikc, Ursula Raczyk-Stanisławiakc, NataliyaKlymenkob, JacekNawrockic a Umeå University, Department of Chemistry e-mail:ivan.kozyatnyk@chem.umu.se b Institute of Colloid Chemistry and Chemistry of Water, National Academy of Sciences of Ukraine cDepartment of Water Treatment Technology, Adam Mickiewicz University
BDOC content of fulvic acids • Peat fulvic acids (PFA) – 3,93 mg C/L (57 % DOC) • River fulvic acids (RFA) - – 0,89 mg C/L(13 % DOC) Sidfot
Fulvic acids properties FTIR-spectra of fulvic acids Molecular weight distribution of Dnieper river and high-moor peat FA Elementary composition of FA
Oxidants • Chlorine – 0.2; 0.8 and 1.4 mg Cl2/L (0.03; 0,12 and 0,21 mg Cl2/mg C) • Chlorine dioxide – 0.2; 0.8 and 1.4 mg ClO2/L(0.03; 0,12 and 0,21 mg ClO2/mg C) • Ozone – 6; 12 and 18 mg O3/L (0.03; 0,12 and 0,21 mg O3/mg C)
Molecular weight distribution of FA after treatment with chlorine dioxide.
By-product formation after FA treatment Content of organic acids in solutions of FA Content of aldehydes in solutions of FA Content of organic acids in solutions of FA.
Conclusion • Peat and Dnipro FA have very similar compositions. FTIR, SEC, and elementary analysis data confirmed this. However, the BDOC content in peat FA is higher than in Dnipro river FA. • In the case of FA with low content of BDOC, the vital activity of bacteria was carried out not only due to the mineralization of low molecular weight compounds but also as a consequence of the biotransformation of high molecular ones. • Using the given doses of chlorine [0.2, 0.8, and 1.4 mg L-1 (0.03, 0.12, and 0.21 mg mg-1 C] did not lead to significant changes of RFA and PFA after 1 and 24 h since treatment. We observed chlorine substitution into the FA structure. PFA with high BDOC content are more susceptible to chlorination because about 1 μg L-1 of THM appear. • MDW and SUVA in both samples of FA did not change within a 1 h after treatment with chlorine dioxide. Chlorine dioxide oxidized FA stronger than chlorine. Organic matter became more biodegradable. However, ClO2 can remain in treated water for about 24 h, which can decrease the efficiency of microorganisms in biofilters. • During ozonation of FA, we found the highest increase of BDOD due to the formation of a high amount of organic acids and aldehydes. NOM molecules were transformed into a more biodegradable form. Ozonation is the most preferable process among those observed for pre-treatment of FA before biofiltration.