Download
1 / 23
230 likes | 305 Views
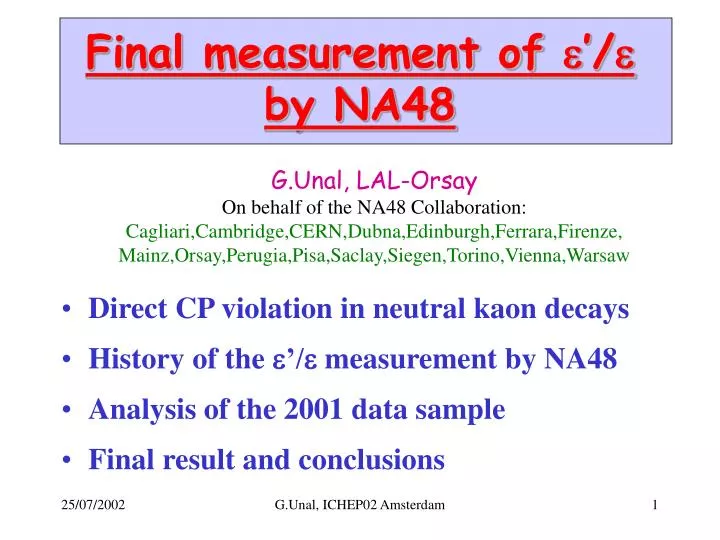
Final measurement of e ’/ e by NA48. Direct CP violation in neutral kaon decays History of the e ’/ e measurement by NA48 Analysis of the 2001 data sample Final result and conclusions. G.Unal, LAL-Orsay On behalf of the NA48 Collaboration:

E N D
Final measurement of e’/e by NA48 • Direct CP violation in neutral kaon decays • History of the e’/e measurement by NA48 • Analysis of the 2001 data sample • Final result and conclusions G.Unal, LAL-Orsay On behalf of the NA48 Collaboration: Cagliari,Cambridge,CERN,Dubna,Edinburgh,Ferrara,Firenze, Mainz,Orsay,Perugia,Pisa,Saclay,Siegen,Torino,Vienna,Warsaw G.Unal, ICHEP02 Amsterdam
CP violation in neutral kaon decays • CP violation in mixing (« indirect ») KL = K2 +e K1 KS = K1 + e K2 (K1,K2 = CP eigenstates) |e| = (2.28±0.02)10-3 • CP violation in p p decay A(KLp+p-)/A(KSp+p-) = e + e’ A(KLp0p0)/A(KSp0p0) = e – 2 e’ e’ = «direct » CP violation (interference between I=0 and I=2 amplitudes) Standard Model: both e and e’ Quantitative predictions difficult:e’/e (-10 to +30) 10-4 G.Unal, ICHEP02 Amsterdam
The double ratio R • need to measure small deviation of R from 1 • reduce to event counting if at least 2 modes taken simultaneously • NA48 method: • take the 4 modes • simultaneously (cancellation of dead time, inefficiencies, …) • fromsame decay region • KL events are weighted to have same decay distribution as KS(minimise detector acceptance correction) • high resolution detectorsminimise residual backgrounds • KS/KL identification by « tagging » the proton creating the KS G.Unal, ICHEP02 Amsterdam
The Simultaneous KS and KL beams not to scale G.Unal, ICHEP02 Amsterdam
The NA48 detector p0p0 detection ( 4 g) LKr calorimeter s(E)/E=0.032/E0.09/E0.0042 < 1% for E=25 GeV p+p- detection magnetic spectrometer s(p)/p = 0.5%0.9%(p/100 GeV) G.Unal, ICHEP02 Amsterdam
History of the e’/e measurement by NA48 Year:19971998 199920002001 N(KL2p0) 0.5 M 1 M 2 M - 1.5 M improvements in LKr, triggers, DAQ,efficiency Beam tube implosion Cross-checks with neutrals (+rare Ks decays) Drift chambers rebuilt Lower beam intensity e’/e = (15.32.6)10-4 (published in 2001) Result today ! G.Unal, ICHEP02 Amsterdam
Summary of uncertainties on R for 98-99 data related to beam intensity effects smaller uncertainties for 2001 data Example: p+p- trigger efficiency increased from 97.78% to 98.70% smaller uncertainty in efficiency measurement G.Unal, ICHEP02 Amsterdam
1998-1999spill=2.4s every 14.4s 2001 spill=5.2s every 16.8s => 80 % higher duty cycle Instantaneous beam intensity reduced by 30% Dead time in drift chamber readout: 20% 11% (this dead time condition is recorded and applied in the analysis to all events) G.Unal, ICHEP02 Amsterdam
2001 1998-1999 slightly better efficiency Performances of rebuilt DCH similarp+p- mass resolution G.Unal, ICHEP02 Amsterdam
Analysis of the 2001 data sample (some selected topics…) p0p0p+p- G.Unal, ICHEP02 Amsterdam
p0p0 reconstruction Decay region definition Energy scale 1 cm on decay vertex 10-4 on E-scale D(vertex-LKr) = 1/M(K) Ei Ej dij (from K mass constraint) Cross-check: use p0p0 hadronic production from p- beam striking two thin targets during special runs Adjust E-scale to reproduce nominal position of AKS KSp0p0 Total uncertainty (E-scale+non linearities+…) = 5.3 10-4 on R G.Unal, ICHEP02 Amsterdam
Acceptance Weight KL events to equalize decay vertex distribution and make detector acceptance the same Residual correction (beam geometry) D(R) = (21.93.54.0) 10-4 Does not rely on detailed detector simulation G.Unal, ICHEP02 Amsterdam
KS-KL identification R sensitive top+p-p0p0differences DaSL =(00.5)10-4 DR = (03)10-4 DaLS =(3.41.4)10-4 DR =(6.92.8)10-4 From vertex-identifiedp+p-: aSL=(1.12±0.03)10-4(KS tagging inefficiency) aLS=(8.115±0.010)%(KL accidental tagging) Higher losses related to beam intensity in p+p- Can be predicted using overlay technique Time in spill (s) G.Unal, ICHEP02 Amsterdam
Accidental effects • Accidental effectevent losses induced by (KL) beam activity • Miminised by simultaneous data collection in 4 modes • DR = D(p0p0-p+p-) * D(KL-KS) • D(p0p0-p+p-) minimised by applying to all events the recorded • dead time conditions • main tool: overlay pp events with random events ( beam intensity) • D(KL-KS)small by design of the experiment: • simultaneous beam • KS and KL decays see the same beam intensity • deviation =« intensity difference effect » • lifetime weighting • KS and KLdecays illuminate the same part of the detector • residual effect =« illumination difference effect » G.Unal, ICHEP02 Amsterdam
Event losses(from overlay): D(p+p--p0p0)=(1.0±0.5)% for 2001 data Better check of linearity of losses in 2001 (better beam monitors) Measure accidental activity ( KL beam intensity) in KS and KLevents DI/I = (0±1)% G.Unal, ICHEP02 Amsterdam
Uncertainties from accidental effects: • Intensity difference effect: • from estimates ofD(p+p--p0p0)andDI/I • DR = ± 1.1 10-4 • (was ±3 10-4 for 98-99 data) • Illumination difference effect: • overlaying « random » events to KS and KL decays • DR = ± 3.0 10-4 • (limited by statistical uncertainty of overlay sample) G.Unal, ICHEP02 Amsterdam
Summary of corrections and uncertainties on R for 2001 data G.Unal, ICHEP02 Amsterdam
Cross-checks of the stability of the result 2001 data published 98-99 data G.Unal, ICHEP02 Amsterdam
The double ratio result (2001 data) The analysis is performed in Kaon energy bins to be insensitive to KS-KL differences in energy spectra R = 0.99181 ± 0.00147 stat ± 0.00110 syst G.Unal, ICHEP02 Amsterdam
Final result From 2001 data: e’/e = (13.7±2.5±1.8)10-4 =(13.7±3.1) 10-4 in very good agreement with 97-98-99 published result e’/e = (15.3±2.6)10-4 Final combined result from NA48: e’/e = (14.7±2.2)10-4 (correlated systematic uncertainty is ±1.4 10-4) G.Unal, ICHEP02 Amsterdam
e’/e vs data taking year G.Unal, ICHEP02 Amsterdam
Comparison of experimental results NA31: (23.0±6.5)10-4 E731: (7.4±5.9)10-4 KTeV: (20.7±2.8)10-4 (preliminary) NA48: (14.7±2.2)10-4 World averagee’/e = (16.6±1.6)10-4c2=6.2/3 (prob=10%) G.Unal, ICHEP02 Amsterdam
Conclusions NA48 measurement of e’/e is completed: e’/e = (14.7±2.2) 10-4 proposed accuracy is reached papers: - V.Fanti et al, Phys. Lett. B465, 335(1999) 97 data result - A.Lai et al, Eur. Phys. Jour.C83,22(2001) 98-99 data - coming out soon on 2001 data KTeV still to analyse 1999 data (same stat as 96-97 data) Kloe with different method (need luminosity) The ball is now on the theory side … G.Unal, ICHEP02 Amsterdam