Download
1 / 1
10 likes | 93 Views
Biomolecular prostate cancer detection in minimale prostate tissue samples – a feasible additional diagnostic tool ? S. Schneider 1 , J. Seifert 1 , S. Propping 1 , S. Voigt 1 , A. Lohse-Fischer 1 , S. Tomasetti 1 , S. Fuessel 1 , M. Haase 2 ,

E N D
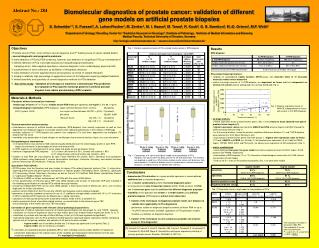
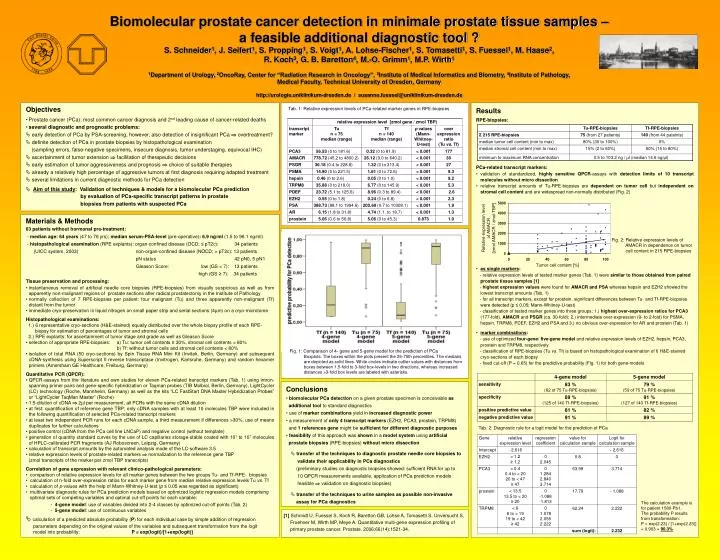
Biomolecular prostate cancer detection in minimale prostate tissue samples – a feasible additional diagnostic tool ? S. Schneider1, J. Seifert1, S. Propping1, S. Voigt1, A. Lohse-Fischer1, S. Tomasetti1, S. Fuessel1, M. Haase2, R. Koch3, G. B. Baretton4, M.-O. Grimm1, M.P. Wirth1 1Department of Urology, 2OncoRay, Center for “Radiation Research in Oncology”, 3Institute of Medical Informatics and Biometry, 4Institute of Pathology, Medical Faculty, Technical University of Dresden, Germany http://urologie.uniklinikum-dresden.de / susanne.fuessel@uniklinikum-dresden.de • Results • RPE-biopsies: • PCa-related transcript markers: • validation of standardized, highly sensitive QPCR-assays with detection limits of 10 transcript molecules without micro dissection • relative transcript amounts of Tu-RPE-biopsies are dependent on tumor cell but independent on stromal cell content and are widespread non-normally distributed (Fig. 2) • as single markers: • - relative expression levels of tested marker genes (Tab. 1) were similar to those obtained from paired prostate tissue samples [1] • - highest expression values were found for AMACR and PSA whereas hepsin and EZH2 showed the lowest transcript amounts (Tab. 1) • - for all transcript markers, except for prostein, significant differences between Tu- and Tf-RPE-biopsies were detected (p ≤ 0.05; Mann-Whitney-U-test) • - classification of tested marker genes into three groups: 1.) highest over-expression ratios for PCA3 (177-fold), AMACR and PSGR (ca. 30-fold); 2.) intermediate over-expression (9- to 2-fold) for PSMA, hepsin, TRPM8, PDEF, EZH2 and PSA and 3.) no obvious over-expression for AR and prostein (Tab. 1) • marker combinations: • - use of optimized four-gene/ five-gene model and relative expression levels of EZH2, hepsin, PCA3, prostein and TRPM8, respectively • - classification of RPE-biopsies (Tu vs. Tf) is based on histopathological examination of 6 H&E-stained cryo-sections of each biopsy • - fixed cut-off (P = 0.65) for the predictive probability (Fig. 1) for both gene-models Tab. 1: Relative expression levels of PCa-related marker genes in RPE-biopsies Relative expression level of AMACR [zmol AMACR / zmol TBP] Fig. 2: Relative expression levels of AMACR in dependence on tumor cell content in 215 RPE-biopsies Tumor cell content [%] Fig. 1: Comparison of 4- gene and 5-gene model for the prediction of PCa Boxplots: The boxes within the plots present the 25-75th percentiles. The medians are depicted as solid lines. White circles indicate outlier values with distances from boxes between 1.5-fold to 3‑fold box-levels in two directions, whereas increased distances >3-fold box levels are labeled with asterisks. • Objectives • Prostate cancer (PCa): most common cancer diagnosis and 2nd leading cause of cancer-related deaths • several diagnostic and prognostic problems: • early detection of PCa by PSA-screening, however, also detection of insignificant PCa overtreatment? • definite detection of PCa in prostate biopsies by histopathological examination (sampling errors, false-negative specimens, insecure diagnosis, tumor understaging, equivocal IHC) • ascertainment of tumor extension facilitation of therapeutic decisions • early estimation of tumor aggressiveness and prognosis choice of suitable therapies • already a relatively high percentage of aggressive tumors at first diagnosis requiring adapted treatment • several limitations in current diagnostic methods for PCa detection • Aim of this study: Validation of techniques & models for a biomolecular PCa prediction by evaluation of PCa-specific transcript patterns in prostate biopsies from patients with suspected PCa • Materials & Methods • 63 patients without hormonal pre-treatment: • - median age: 64 years (47 to 76 yrs); median serum-PSA-level (pre-operative): 6.9 ng/ml (1.5 to 96.1 ng/ml) • - histopathological examination (RPE explants): organ-confined disease (OCD; ≤ pT2c): 34 patients • (UICC system, 2003) non-organ-confined disease (NOCD; > pT2c): 13 patients • pN status 42 pN0, 5 pN1 • Gleason Score: low (GS < 7): 13 patients • high (GS ≥ 7): 34 patients • Tissue preservation and processing: • instantaneous removal of artificial needle core biopsies (RPE-biopsies) from visually suspicious as well as from apparently non-malignant regions of prostate sections after radical prostatectomy in the Institute of Pathology • normally collection of 7 RPE-biopsies per patient: four malignant (Tu) and three apparently non-malignant (Tf) distant from the tumor • immediate cryo-preservation in liquid nitrogen on small paper strip and serial sections (4µm) on a cryo-microtome • Histopathological examinations: • 1.) 6 representative cryo-sections (H&E-stained) equally distributed over the whole biopsy profile of each RPE- • biopsy for estimation of percentages of tumor and stromal cells • 2.) RPE explants: for ascertainment of tumor stage and grade as well as Gleason Score • selection of appropriate RPE-biopsies: a) Tu: tumor cell contents ≥ 30%, stromal cell contents < 80% • b) Tf: without tumor cells and stromal cell contents < 80% • isolation of total RNA (50 cryo-sections) by Spin Tissue RNA Mini Kit (Invitek, Berlin, Germany)and subsequent cDNA-synthesis using Superscript II reverse transcriptase (Invitrogen, Karlsruhe, Germany) and random hexamer primers (Amersham GE Healthcare, Freiburg, Germany) • Quantitative PCR (QPCR): • QPCR-assays from the literature and own studies for eleven PCa-related transcript markers (Tab. 1) using intron-spanning primer pairs and gene-specific hybridization or Taqman probes (TIB Molbiol, Berlin, Germany), LightCycler (LC) technology (Roche, Mannheim, Germany) as well as the kits “LC FastStart DNA Master Hybridization Probes” or “LightCycler TaqMan Master” (Roche) • 1:5-dilution of cDNA 2µl per measurement, all PCRs with the same cDNA dilution • at first: quantification of reference gene TBP; only cDNA samples with at least 10 molecules TBP were included in the following quantification of selected PCa-related transcript markers • at least two independent PCR runs for each cDNA sample, a third measurement if differences >30%, use of means duplicates for further calculations • positive control (cDNA from the PCa cell line LNCaP) and negative control (without template) • generation of quantity standard curves by the use of LC capillaries storage-stable coated with 101 to 107 molecules of HPLC-calibrated PCR fragments (AJ Roboscreen, Leipzig, Germany) • calculation of transcript amounts by the automated analysis mode of the LC-software 3.5 • relative expression levels of prostate-related markers normalization to the reference gene TBP • (zmol transcripts of the marker per zmol TBP transcripts) • Correlation of gene expression with relevant clinico-pathological parameters: • comparison of relative expression levels for all marker genes between the two groups Tu- and Tf-RPE- biopsies • calculation of n-fold over-expression ratios for each marker gene from median relative expression levels Tu vs. Tf • calculation of p-values with the help of Mann-Whitney-U-test (p ≤ 0.05 was regarded as significant) • multivariate diagnostic rules for PCa prediction models based on optimized logistic regression models comprising • optimal sets of competing variables and optimal cut-off points for each variable: • - 4-gene model: use of variables divided into 2-4 classes by optimized cut-off points (Tab. 2) • - 5-gene model: use of continuous variables • calculation of a predicted absolute probability (P) for each individual case by simple addition of regression • parameters depending on the original values of the variables and subsequent transformation from the logit • model into probability: P = exp(logit)/[1+exp(logit)] • Conclusions • biomolecular PCa detection on a given prostate specimen is conceivable as • additional tool to standard diagnostics • use of marker combinations yield in increased diagnostic power • a measurement of only 4 transcript markers (EZH2, PCA3, prostein, TRPM8) • and 1 references gene might be sufficient for different diagnostic purposes • feasibility of this approach was shown in a model system using artificial • prostate biopsies (RPE-biopsies) without micro dissection • transfer of the techniques to diagnostic prostate needle core biopsies to validate their applicability in PCa diagnostics (preliminary studies on diagnostic biopsies showed: sufficient RNA for up to 10 QPCR measurements available, application of PCa prediction models feasible validation on diagnostic biopsies) • transfer of the techniques to urine samples as possible non-invasive assay for PCa diagnostics Tab. 2: Diagnostic rule for a logit model for the prediction of PCa The calculation example is for patient 1580-Pb1. The probability P results from transformation: P = exp(2.23) / [1+exp(2.23)] = 0.903 = 90.3% [1] Schmidt U, Fuessel S, Koch R, Baretton GB, Lohse A, Tomasetti S, Unversucht S, Froehner M, Wirth MP, Meye A. Quantitative multi-gene expression profiling of primary prostate cancer. Prostate. 2006;66(14):1521-34.