Download
1 / 16
210 likes | 586 Views
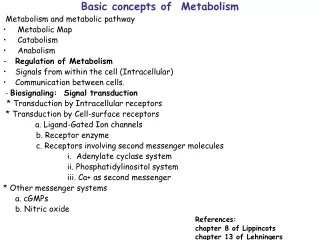
Integration of Metabolism. Metabolic effects of Insulin and Glucagon Metabolism in the Well fed state Metabolism in the Starvation and Diabetes Mellitus. Metabolism of starvation and diabetes *Starvation: Results from inability to obtain food that can be resulted from

E N D
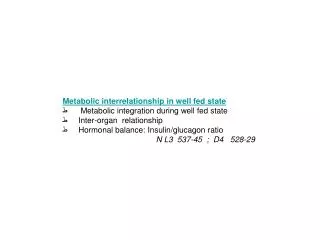
Integration of Metabolism • Metabolic effects of Insulin and Glucagon • Metabolism in the Well fed state • Metabolism in the Starvation and Diabetes Mellitus
Metabolism of starvation and diabetes *Starvation: Results from inability to obtain food that can be resulted from A) Intentionally (reduce weight rapidly) B) Clinical situation in which person cannot eat because of trauma, surgery, burns, In the absence of food low glucose, TG, a.a, in blood low insulin / glucagon ratio and low substrate availability Catabolic period characterized by high TG degradation, high glycogen and a.a catabolism *Exchanges between tissues liver, adipose, muscle determined by two priorities: A) The need to maintain plasma glucose level to sustain energy for brain and other glucose-requiring tissues. B) The need to mobilize fatty acids from adipocytes and keton bodies to supply energy to all other tissues. *Fuel stores: Metabolic fuel including glycogen (0.2 kg), Fat(15 kg) and proteins (6 kg) - Only 1/3 of proteins can be used as energy safely *Enzymatic changes in starvation: Determined by 1) Availability by substrates. 2) Allosteric regulators 3) Covalent modification. 4) Induction-repression of enzyme synthesis. *The metabolic changes observed in starvation are generally opposite to these in well-fed state.
I. Liver in starvation A- CHO metabolism - Liver first uses glycogen degradation then gluconeogenesis to maintain blood glucose level to provide energy for brain *Sources of blood glucose 1- Diet 2- Glycogen 3- Gluconeogenesis Liver response to starvation A) Glycogen degradation starts 3 hours after the last meal and provide the blood with glucose for about 10-18hours. Liver glycogen exhausted after 10–18hours. B) Increase gluconeogenesis: -Plays essential rule in maintaining glucose level during both overnight and prolonged fasting -Substrates for gluconeogenesis: a.a (carbon skeletons), Pyruvate, Glycerol (from TG) - Gluconeogenesis starts 4–6hours after last meal and become fully active when glycogen store is depleted.
B- Fat metabolism 1) High fatty acid oxidation that derived from TG (adipose tissue) is the major source of energy in hepatic cells. (glucose is the major source of energy in case of well-fed state) 2) Increase synthesis of ketone bodies Ketone bodies synthesis is the favored when concentration of acetyl-CoA is higher than oxidation capacity of TCA cycle. Significant synthesis of ketone bodies starts in the first days of starvation. Circulating ketone bodies are important to provide energy for peripheral tissues including brain.
II. Adipose tissue in starvation A- CHO metabolism - Glucose transport into adipocytes is reduced decrease glycolysis decrease fatty acids and TG synthesis because also of decreased insulin. B- Fat metabolism I) Increase degradation of TG *Hormone sensitive lipase is activated by 1) Low level of insulin. 2) High level of epinephrine and nor-epinephrine activate TG degeneration and release of fatty acids II) Increase release of fatty acid - Fatty acids released from hydrolysis of stored TG bound to albumin and transported to tissues to be used as fuel.
Glycerol that resulted from TG degredation is used in gluconeogenesis by liver. Decrease uptake of fatty acids: by adipocytes decrease TG synthesis - In starvation decrease activity of lipo-protein lipase of adipocytes circulating TG of lipo-proteins is decreased. * Fatty acids are taken by the liver and degraded by B-oxidation accumulation of Acetyl CoA activation of Ketone body formation increasing the circulatory ketone bodies
III. Skeletal muscle in starvation A- CHO metabolism low insulin decrease uptake of glucose by skeletal muscle glucose metabolism is decreased. B- Lipid metabolism During the first two weeks of starvation muscle uses fatty acids from adipose tissue and ketone bodies as fuel. After three weeks muscle decrease utilization of ketone bodies and use only fatty acids increase circulating ketone bodies. C- Protein metabolism During the first few days of starvation rapid degradation of muscle protein providing a.a for gluconeogenesis. After several weeks of starvation, the rate of muscle protein degradation decrease a decline in need for glucose as fuel for brain.
IV. Brain in starvation First days of starvation, brain uses only glucose (from gluconeogenesis). After 2 – 3 weeks, brain starts using ketone bodies decrease gluconeogenesis as source of glucose.
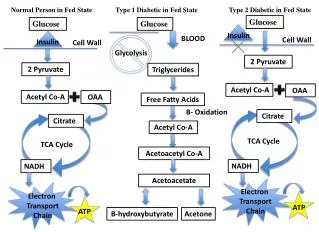
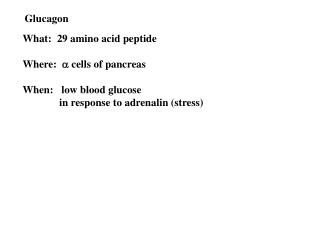
Diabetis Mellitus - Major health problem - Heterogeneous group of syndromes characterized by an elevation of FBG (Fasting Blood Glucose), caused by relative or complete absence of insulin. (high blood glucose and low insulin) - Metabolic changes caused by low insulin release and aggregated release of glucagon. *Diabetes types: Insulin Dependent DM (IDDM) Non-Insulin Dependent DM (NIDDM) IDDM (Type I Diabetes) - Requires insulin to avoid life-threatening keto acidosis - Absolute deficiency of insulin caused by massive autoimmune attack on the β-cell of pancreas. * Insulitis - Rule of T-lymphocytes in IDDM - Symptoms appear abruptly after 80 – 90% of β-cell has been destroyed pancreas fail to respond to ingested glucose.
Diagnosis of Type I - Abrupt appearance of polyurea, polydypsia, polyphagia with fatigue, weight loss, weakness and with FBG to greater than 140 mg/dl - Appearance of glucose in urine. *Metabolic changes in Type I - Hyperglycemia and Ketoacidosis - Hyperglycemia is caused by increased hepatic production of glucose combined with decrease in peripheral utilization. - These effects due to low insulin and high glucagon. * Ketosis: increase mobilization of fatty acids from adipocytes compined with increase hepatic synthesis of ketone bodies. - Not all fatty acids degraded are oxidized, but can be used in TG biosynthesis of VLDL released into blood. - Chylomicrones & VLDL level are elevated because lipoprotein lipase is inactivated or low in diabetic persons hypertriglyceridemia. - Low insulin / glucagon increase gluconeogenesis and increase ketogenesis.
* Metabolic changes in IDDM resemble to changes in starvation except that they are more exaggerated. * Treatment of IDDM: they have no functional β-cells they depend only on the take of insulin.
* Non-Insulin Dependent Diabetes Melletus (NIDDM) “Type II “ • - Most common affecting 80% of diabetic population. • - Develops gradually without obvious symptoms. • - NIDDM patients have functional β-cells and don’t require insulin to sustain life. • - Highly determined by genetic factors. • - Metabolic alterations observed in NIDDM are milder than that of IDDM. • * NIDDM results from: • a) Dysfunctional β-cells. • - β-cells function is reduced insulin can be normal or below normal, but β-cells fail to secrete enough insulin to correct hyperglycemia. • b) Insulin resistance. • - Tissues fail to respond normally to insulin. Usually it is accompanied by target organ insulin resistance. • - Liver resistance to insulin leads to uncontrolled hepatic glucose production. • - Muscle and adipose tissues decrease glucose uptake by these tissues. • - Also type II can be due to number of defects of signal transduction.
* Treatment of Type II • The goal of treating type II is to maintain normal glucose level. • Wight reduction. • Dietary modifications. • Hypoglycemic agent. • Complicated cases insulin is required. • * Chronic effects of Diabetes: • Atherosclerosis • Retinopathy • Nephropathy • neuropathy