Download
1 / 25
260 likes | 330 Views
Learn moving average which is essential part of technical analysis now

E N D
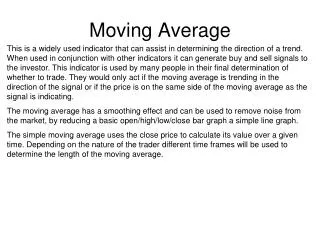
Moving Average Technical Analysis
What is Average • We all know average is the mean value. • It is obtained by adding all the quantities and dividing the sum by number of quantities. • Example-we have to find the average of 10,20 and 30. • 10+20+30/3=60/3=20
Why the term moving average • We all know that the prices of the shares fluctuate continuously. • If we want to find the average price of the shares for particular days, we will have to add up the closing prices of the share for that period and divide it by number of days for which we are finding out.
Why the term moving average • Suppose we want to find the 10 Day moving average(DMA) of a stock. • We will have to add up the price of the stock for last 10 days till todays market closing price. • But tomorrow the stock will close at a different price and then for calculating 10DMA we will have to add the closing price of tomorrow and omit the first one.
Why the term moving average • So as is evident the average will move with respect to the last day’s closing price. • If the last day’s closing is more than the first day’s that we are omitting ,then the moving average will have an upward trend. • And vice versa. So the average is not stagnant. So the term moving average.
Standard moving Averages • As average can be of any number of days a standardization was required. • We generally use(in India): • 13DMA • 30DMA • 200DMA • Day Moving average(DMA) and Simple moving average(SMA) are same things.
Price and 13 DMA Graph • Lets us now see how does a graph of price and 13 DMA looks like in an upward trend.
Price and 13 DMA Graph • The DMA will go down if the recent closing is less than the last price that is to be omitted as shown below:
The relation between 13 DMA and price • The price cannot move too much high from 13DMA.If price has moved high from 13 DMA then it will come back to 13 DMA and it should not be purchased but can be shorted. • If the price is close to 13 DMA then the stock can be purchased as the price might increase from there.
Some Buy/Sell cases • The movement of 30 DMA will be less rapid than 13DMA as it average more number of days. • Let us now think of a case where the 13 DMA and 30 DMA are both in upward direction.
Some Buy/Sell cases • 13 DMA is crossing over 30 DMA.It gives a buy signal at that crossing. It should not be bought straight but rather should be watched out for buying opportunity.
Some Buy/Sell cases • Similarly the 13 DMA takes and faster turn and crosses over 30DMA again as shown above. • The crossover gives a sell signal.Then we should look for selling opportunities.
Some Buy/Sell cases • Now consider a case where the price of a stock moves up very rapidly above 13 DMA.And the 30 DMA has not moved much. • The stock falls rapidly at a point where the 13 DMA takes a sharp bent and should be shorted there.
Some Buy/Sell cases • Here the 30 DMA is in uptrend.But the stock price is forming a range and is not moving up.The 13 DMA is curved and is also not moving much.13 DMA is forming a curve and going lower.
Some Buy/Sell cases • Then all of a sudden the 13 DMA moves up.That is the point where we want to take long position. • It is generally seen between 12 th to 16 th day of the month where rapid rise will be seen. • Valid break out should be seen before the upmove. • The stock might move 20-30% of the underlying value.
Some Buy/Sell cases • The 13 DMA is in upward trend. • The price moves in parallel direction for a few sessions. • It creates a resistance at a upper level. • We have to wait for a valid breakout. • Stock may rally 30% following the breakout. Committed buyer will be there as they have shorted and short covering will propel the rally.
Some Buy/Sell cases • If a stock is above 200 DMA then it is a good stock. • We can take long position when price comes at lower level. • We can take short position when price goes to upper level. • 200 DMA acts as LOC.
Some Buy/Sell cases • If the stock is below 200 DMA then we should take long position when it is very down. • When it is close to 200 DMA it should be shorted. • 200 DMA acts a LOC(Line of contro)
Some Buy/Sell cases • Stock falling toward 200 DMA for the first time: • If the stock breaks 200 DMA then the closing will be above 200 DMA that day as 200DMA acts as strong support.
Some Buy/Sell cases • After breaking 200DMA the stock will trade in particular range for 45 mins. to 1 hr. • Then there will be valid breakout. • Buy the stock at this point as the closing will be above 200 DMA. • Example: Here the price is considered to range between 475 to 480 for 45 mins. To 1hr.Buy at breakout at 480 level for a target of 200 DMA level with stop loss at 475.
Some Buy/Sell cases • 2ND time going towards 200 DMA-After going above 200 DMA the stock may again come towards 200 DMA.This time the stock has 50:50 chance of going up or breaking 200DMA.This time we need not take any position.
Some Buy/Sell cases • 3RD time going towards 200 DMA-If the stock falls for the 3rd time toward 200 DMA then there are two possibilities: • 1.If the stock closes above 200 DMA then it will rise up for long term i.e. 6 months to 1 yr.So take long position in that case. • 2.If the stock closes below 200 DMA then it will fall for long term i.e. 6 months to 1 yr.So take short position in that case.
Some Buy/Sell cases • Conclusion:
THANK YOU • Visit us at WayToInvesting- A Blog on Stock Marketto learn technical analysis!