Download
1 / 65
670 likes | 821 Views
Addressing Climate Change in the World and in the Grinnell College 2012 Policy Studies Seminar. Alumni 50 th Reunion Faculty Lecture Wayne Moyer May 31, 2014. New Information on Climate Change. Fifth Assessment Report of the Intergovernmental Panel on Climate Change (2013-2014)

E N D
Addressing Climate Change in the World and in the Grinnell College 2012 Policy Studies Seminar Alumni 50th Reunion Faculty Lecture Wayne Moyer May 31, 2014
New Information on Climate Change • Fifth Assessment Report of the Intergovernmental Panel on Climate Change (2013-2014) • National Climate Assessment (May, 2014)
Anthropogenic Perturbation of the Global Carbon Cycle Perturbation of the global carbon cycle caused by anthropogenic activities, averaged globally for the decade 2002–2011 (PgC/yr) Source: Le Quéré et al. 2012; Global Carbon Project 2012
Fate of Anthropogenic CO2 Emissions (2002-2011 average) Source: Le Quéré et al. 2012; Global Carbon Project 2012 8.3±0.4 PgC/yr 90% 4.3±0.1 PgC/yr 46% 2.6±0.8 PgC/yr 28% Calculated as the residual of all other flux components + 1.0±0.5 PgC/yr 10% 26% 2.5±0.5 PgC/yr
From the 2007 IPCC “Climate Change 2007, Physical Science Basis, Summary for Policy Makers http://www.ipcc.ch/pdf/assessment-report/ar4/wg1/ar4-wg1-spm.pdf
Global Temperature and Carbon Dioxide1880 1900 1920 1940 1960 1980 2000
From the 2007 IPCC “Climate Change 2007, Synthesis Report, Summary for Policy Makers http://www.ipcc.ch/pdf/assessment-report/ar4/syr/ar4_syr_spm.pdf
From the 2007 IPCC “Climate Change 2007, Synthesis Report, Summary for Policy Makers http://www.ipcc.ch/pdf/assessment-report/ar4/syr/ar4_syr_spm.pdf
From the 2007 IPCC “Climate Change 2007, Synthesis Report, Summary for Policy Makers http://www.ipcc.ch/pdf/assessment-report/ar4/syr/ar4_syr_spm.pdf
From the 2007 IPCC “Climate Change 2007, Synthesis Report, Summary for Policy Makers http://www.ipcc.ch/pdf/assessment-report/ar4/syr/ar4_syr_spm.pdf
Fossil and Cement Emissions Global fossil and cement emissions: 9.5±0.5PgC in 2011, 54% over 1990 Projection for 2012: 9.7±0.5PgC, 58% over 1990 Uncertainty is ±5% for one standard deviation (IPCC “likely” range) Source: Peters et al. 2012a; Le Quéré et al. 2012; CDIAC Data; Global Carbon Project 2012
Total Global Emissions Total global emissions: 10.4±0.7PgC in 2011, 37% over 1990 Percentage land-use change: 36% in 1960, 18% in 1990, 9% in 2011 Land-use change black line: Includes management-climate interactions Source: Le Quéré et al. 2012; Global Carbon Project 2012
Emissions from coal, oil, gas, cement Emissions growth 2000-2011: coal (4.9%/yr), oil (1.1%/yr), gas (2.7%/yr), cement (6.9%/yr), flaring (4.3%/yr, not shown) Source: CDIAC Data; Le Quéré et al. 2012; Global Carbon Project 2012 Share of global emissions in 2011
Observed Emissions and Emission Scenarios Emissions are heading to a 4.0-6.1ºC “likely” increase in temperature Large and sustained mitigation is required to keep below 2ºC Linear interpolation is used between individual datapoints Source: Peters et al. 2012a; Global Carbon Project 2012;
Challenges to keep below 2ºC An emission pathway with a “likely chance” to keep the temperature increase below 2ºC has significant challenges Source: Peters et al. 2012a; Global Carbon Project 2012 • Short-term • Reverse emission trajectory • Emissions peak by 2020 • Medium-term • Sustain emission trajectory • Around 3%/yr reductions globally • Long-term • Net negative emissions • Unproven technologies
Previous CO2 emission reductions Without climate policies, some countries have reduced emissions at 1-5%/yr Repeating with modern low-carbon technologies can “kick-start” mitigation Grey areas are: World War I, Great Depression, World War II, oil shocks Source: Peters et al. 2012a; CDIAC Data;Global Carbon Project 2012 Belgium Increased Nuclear Reduced Oil France Increased Nuclear Reduced Oil & Coal United Kingdom Coal to gas Reduced Oil Increased Nuclear Sweden Increased Nuclear Reduced Oil
The recent shift from coal to gas in the USA The recent shift from coal to gas in the US could “kick start” mitigation To keep below 2ºC requires a shift to technologies with lower emissions Grey areas are: World War I, Great Depression, World War II, oil shocks Source: Peters et al. 2012a; CDIAC Data; Global Carbon Project 2012
Top Fossil Fuel Emitters (Absolute) Top four emitters in 2011 covered 62% of global emissions China (28%), United States (16%), EU27 (11%), India (7%) The growing gap between EU27 and USA is due to emission decreases in Germany (45% of the 1990-2011 cumulative difference), UK (19%), Romania (13%), Czech Republic (8%), and Poland (5%) Source: CDIAC Data; Le Quéré et al. 2012; Global Carbon Project 2012
Top Fossil Fuel Emitters (Per Capita) World average per capita emissions in 2011 were 1.4tC/p China (1.8tC/p), United States (4.7tC/p), EU27 (2.0tC/p), India (0.5tC/p) Chinese per capita emissions are almost equal to the EU27, and 36% higher than the global average Source: CDIAC Data; Le Quéré et al. 2012; Global Carbon Project 2012
Main Points to Take Away The world is dumping 9.3 Billion metric tons Carbon Dioxide (CO2) into the atmosphere each year; over 40% comes from the U.S. and China 4.3 Billion metric tonnes of CO2 stays in the atmosphere, with the remainder removed by the ocean or land sinks There is scientific certainty of the atmospheric greenhouse effect – that as CO2 levels increase, more heat from the sun’s radiation is absorbed. If the world continues producing greenhouse gases as it is doing now we can expect average temperature increases by 2100 to increase somewhere between 4 to 6 degrees Celsius. This would have catastrophic effects on water, ecosystems, food, coasts and health. There is uncertainty about the climate effects in particular localities. But, it appears that the most dramatic effects will be felt in the poorest areas of the world, with the least ability to adapt. These are not the regions that are producing the largest quantities of greenhouse gases
Global CO2 emissions continue to increase rapidly, particularly in China and to a lesser extent in India. The principal source of new emissions in coal used in power plants. Coal is responsible for 40 percent of global CO2 emissions. There is international consensus that we should prevent global temperatures from rising more than 2 degrees Celsius by 2100. To do so, emissions would probably have to peak by 2020 and decline by 3.5 percent annually We are not close to achieving this goal. Emissions in the United States and Europe are already declining, but at less than half the rate required for the world to keep the global temperature increase within 2 degrees Celsius. The underlying international policy issue is the division of responsibility for emissions cuts. The developing nations argue that most of the burden should be on the industrial nations who have produced most of the emissions. The industrial nations argue that all nations must take significant action if climate is to be stabilized
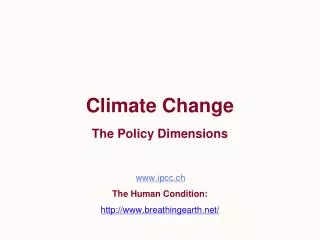
Approaches to International Action to Limit Climate Change • All international agreements depend on state consent (sovereignty). No enforcement mechanisms • Top-down approaches – define particular policies and measures that parties must undertake • Bottom-up approaches – allow parties to define their own contributions
Framework Convention on Climate Change • Signed 1992; Entered into force 1994 • 191 countries and European Union are parties • Stabilization of Greenhouse Gases in Atmosphere • Common but differentiated responsibilities • Parties develop and report on current and projected measures to combat climate change (bottom-up) • Parties undertake to limit emissions • Industrial countries aim to return emissions to 1990 levels by 2000 (top-down)
Kyoto Protocol • Signed 1997; entered into force 2005 • 190 countries and European Union are parties • Emissions Reduction targets for industrial countries 2008-2012 average 5%; U.S. 7% (top-down) • Flexibility Mechanisms • Emissions trading • Joint Implementation • Clean Development Mechanism • Measures to increase carbon uptake from forests and other sinks • Adaptation Fund
December 2009 Copenhagen Climate Conference • Shift from emission targets to pledge and review (bottom-up) • Aspirational goal to limit global warming to +2 degrees Celsius • Developed countries implement economy-wide emission targets by 2020; developing countries implement mitigating action; least developed countries take voluntary action • Reporting, measurement and verification of country actions • Developed countries commit $30 Billion in “new and additional” funding 2010-2012 to help developing countries reduce emissions, preserve forests and adapt to climate change • Ad Hoc Working Group to work toward fuller agreement in Mexico Dec. 2010 • Goal of mobilizing $100 Billion a year by 2020 to address developing country needs • Mechanism to support efforts to reduce emissions from deforestation and forest degradation • Establishment of Copenhagen Green Climate Fund
Recent FCCC Conferences 2010 - Cancun – integrated essential elements of the Copenhagen framework into the Framework Convention on climate change; national pledges 2011 – Durban – established Green Climate Fund; steps toward a second Kyoto commitment; decision to seek new covenant by 2015 to go into force in 2020 2012 – Doha – Authorized extension of Kyoto for eight years; made commitment to provide future resources for Green Climate Fund; developed workstream for 2015 agreement; steps toward measurement, reporting and review 2113 – Warsaw – Nationally determined contributions presented in first quarter of 2015 - but nothing on rules, scope and legal nature of contributions
Issues for a New Climate Agreement – Paris 2015 • Legal form • Long-term goal • Nature of commitments • Transparency/Accountability • Equity/Differentiation • Adaptation • Support for developing countries • Land use
Obstacles to Progress in FCCC Negotiations International GHG assessment • High transactions costs to reach agreement – different interests – poor incentives to keep agreement -weak international institutions to enforce agreements – strong incentives to free-ride • Problem in measuring emissions and in ensuring compliance • Divide between Industrial and Developing nations • Unwillingness of the U.S. to accept emission caps and timetables without emissions reduction commitments from developing countries • Unwillingness of developing countries to accept emissions reductions commitments arguing that development should come first
Policies to Deal with Climate Change Market Policies Carbon Tax Cap and Trade Command and Control (performance targets) Fuel Efficiency standards Renewable energy standards Emissions standards
Impediments to Policy Development in United States • The negative effects of climate change are not obvious to the majority of people. • Climate change policies have immediate costs and only long-term benefits. • Climate change policies probably will lead to increased cost for electricity and gasoline. These costs are directly linked to economic growth and jobs. • Fossil fuel interests are well-organized and strong. • Climate change policy has become highly partisan.
United States Policy • National policies exclusively command and control – not efficient, but benefits are clear and costs to individuals are hidden • Cap and Trade attempted in 2010, but failed in Senate. Some of the reasons for failure included: 1) fear that energy prices would rise; 2) the recession; 3) issue became partisan; 4) lobbying by fossil fuel interests
President Obama’s June 25,2013 Climate Initiative • Directive to Environmental Protection Agency to limit amount of Carbon Dioxide that power plants can produce • Strengthen fuel efficiency standards for buses and trucks • $8 Billion in loan guarantees for deployment of technologies that make fossil fuels less harmful • Encourage wind farms and solar arrays on federal lands • Strengthen energy efficiency in federal buildings
State Policies General Policies Regulation: electricity, natural gas, infrastructure and land use Greenhouse Gas Targets: 20 states Renewable Energy Standards: 29 states Regional Initiatives California: Cap and Trade: Emissions to 1990 levels by 2020 Proposition 39: $2.5 Billion to Energy Conservation Solar Power Subsidy Strict Renewable Energy Standards
Toward More Effective Action in the Future United States: Raise cost of carbon emissions: carbon tax or Cap and Trade Tougher command and control measures Government investment in new technologies and infrastructure Need to mobilize public engagement Internationally: Negotiations in smaller forums than FCCC Commitments contingent on action by others Strengthen incentives for cooperation Work to get firm commitments to cuts by the U.S. and China
Getting Emissions Commitments from the U.S. and China Why firm commitments are difficult even though leaders in both countries understand the need for action U.S. – fears loss of competitiveness if commitment not reciprocated by China; strength of fossil fuel lobbies; fear of consumer retribution if electricity prices rise China – legitimacy of communist party depends on growth; dependency on coal; distorted energy prices; politically powerful industries; Can an agreement be reached? The outlook will be more positive if agreements can be reached to transfer U.S. technologies while protecting intellectual property rights.
China-U.S. July 10, 2013 Agreement • Five Part Plan to cut carbon emissions, pledging to make heavy-duty vehicles more efficient and to do more to limit the output from coal-fired plants. • Pledged to promote energy efficiency in buildings, improve greenhouse data collection and management and smart grids.
PST/POL 320- Applied Policy AnalysisClimate Change • Course Objectives • Understanding of climate change policy domestically and internationally • How government regulations and market incentives compare as a vehicles for mitigating climate change • What are the limits of domestic and international institutions in addressing climate change? • How can we bring science and conceptions of justice to bear in influencing the policy process? • What are the pros and cons of various strategies to address climate change? • Are top-down or bottom-up strategies more effective? • How does the intergenerational character of climate change affect policy development?
PST/POL 320 – Applied Policy AnalysisClimate Change • Introduction- Books • Mike Hulme, Why We Disagree About Climate Change • David G. Victor, Global Warming Gridlock • The Climate Change Challenge • The Discovery of Climate Change • Climate Change Science Overview • IPCC Climate Change 2007 Synthesis Report • National Research Council, “Climate Change: Evidence, Impact and Choices
Policy Models and Climate Change • Rational Decision Making Model: complete information about problems and solutions allows all options to be weighted and the best one chosen. • Bounded Rationality Model: behave as rational as possible given limited time and information • Incremental Model: policy in small steps so that decision makers can process results—an application of bounded rationale model • Organizational Behavior (Bureaucratic) Model: huge organizations as part of standard operating procedure have ways of making decisions which lead to incremental change, grounded in bounded rationality • Governmental Politics: policy results from persuasion, competition, bargaining (similarly to policy/politics stream of Kingdon). • Three Streams: Policy, Politics, Problem streams all need to intersect to open a policy window
Obstacles to Action on Climate Change • Uncertainty, risk, deniers • Paper to persuade skeptic that climate change is real • Science, economics, politics, the power industry • Presentations: Country impacts of climate change • Why people disagree – values, beliefs and fears
Paper to Convince a Skeptic • Write a paper aimed at assigned skeptic presenting the scientific arguments for why that person/group should be concerned about climate change. • Skeptics included: • Midwest farmer - Chamber of Commerce • Coal Mine executive - Highway construction executive • United Auto Workers - Banker • Walmart Executive - Power company executive • Homemaker - Rural County Board