Download
1 / 25
270 likes | 307 Views
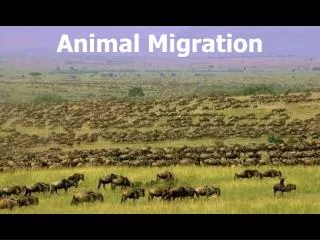
Stable Isotopes and Animal Migration. February 24, 2010. Outline:. Using isoscapes to track animal migration – a quick review. Examples: African elephants - Cerling et al., 2009, PNAS Sockeye Salmon – Finney et al., 2002, Nature American Redstarts – Norris et al., 2004, Science

E N D
Stable Isotopes and Animal Migration February 24, 2010
Outline: • Using isoscapes to track animal migration – a quick review. • Examples: • African elephants - Cerling et al., 2009, PNAS • Sockeye Salmon – Finney et al., 2002, Nature • American Redstarts – Norris et al., 2004, Science • Bats in the eastern US – Britzke et al., 2009, Journal of Mammalogy
Three Principles of isotopic tracking: • The “isoscape terrain” through which the animal of interest moves must be known. • Isotopic values in animals can be offset from base- line isoscape values due to isotopic discrimination and such discrimination factors need to be known for the tissue of interest . • The time period of spatial integration corresponding to a particular animal tissue needs to be known. Hobson et al., 2010
C3/C4/CAM (δ13C, δD): Red-winged Blackbird Example: Study showed strong segregation between two groups of Red-winged Blackbirds clearly related to corn consumption in agricultural areas. Authors further associated those corn areas with more northern latitudes in the USA using feather δD values. Wassenaar and Hobson, 2000
δ13C, δD: 1999, Oecologia Stable hydrogen and carbon isotopic compositions of adult monarch butterflies closely resemble those of their natal (larval) diets. δD provides a good indicator of latitude. Stable carbon isotope values in milkweed and butterfly wings across eastern N. America showed a distinct pattern of enrichment along a SW to NE gradient bisecting the Great Lakes- they provided further resolution in the determination of monarch natal origin.
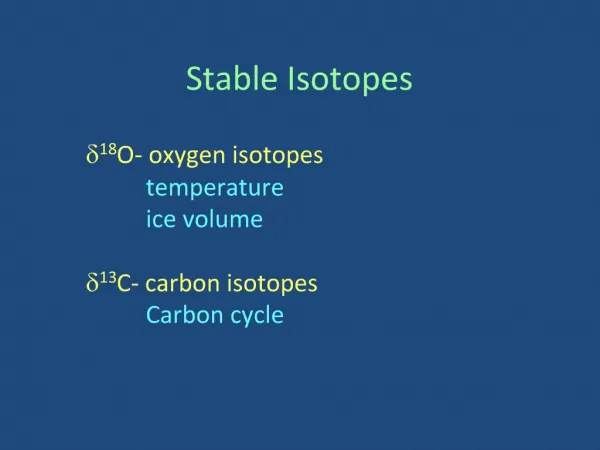
Deuterium and 18O in Precipitation and Surface Waters: 2008, PNAS Ehleringer et al. (2008) showed excellent agreement between drinking water δD and δ18O measurements and those in human hair across the United States.
Strontium Isotopes (87Sr/86Sr): For some freshwater vertebrates, such as fish, dissolved Sr in water is the primary source of Sr in tissues- it therefore has great potential for tracking where fish travel (but requires that geology is different). Hobson et al., 2010
Isotopic turnover: Important to identify whether or not multiple nutrient pools are involved in tissue synthesis, but absolute half lives are less important. Note that the one-pool model (#2) does the worst job of predicting the environment – particularly for the region where the elephant spends the least amount of time. Illustrates the apparent enrichment b/twn diet and tissue is different in different environments and is a result of a non-equilibrium condition. Hobson et al., 2010
Case Studies: • Birds and Insects • Feathers, wing chitin both inert following formation and provide info about origin. • Mammals • Claws, hair, hooves, bone collagen. • Sequential sampling holds great promise. • Fish • Otoliths
Example 1: African elephants 2009, PNAS
Example 1: African elephants MOTIVATION • In the face of climate change, it is of interest to trace the relationship between elephant diet and vegetation change over a long time period, particularly because elephants play such a key role in savanna ecosystems. • Previous studies of African savanna elephants show that they prefer grass during the wet season but rely on browse during the dry season. 6-year, temporally fine-scale chronology of diet change in an elephant family group using isotopes in tail hair. Cerling et al., 2009
Example 1: African elephants %C4 in diet matches fluctuations in rainfall and NDVI in the Samburu region. NDVI = Normalized Differential Vegetation Index High δ15N values correspond with high δ13C values- C4 plants tend to have a higher δ15N value in this ecosystem. Cerling et al., 2009
Example 1: African elephants Changes in diet d13C track the chronology of NDVI values, but lag by several weeks – peak in protein content is likely influential to timing in dietary switching. Changes in dD are more closely synchronized with NDVI – demonstrates importance of seasonal rains. Peak in births will occur 22 months later, at the beginning of the rainy season and just prior to peak grass consumption. Cerling et al., 2009
Example 1: African elephants Cerling et al., 2009
Example 1: African elephants CONCLUSIONS • Seasonal diet changes are well correlated with changes in NDVI. • Dry season δ13C values have a baseline value that indicates a diet composed of 5 – 20% C4 biomass. • The peak in grass consumption occurs ~2 weeks after the peak in NDVI. • Long-term NDVI changes will likely be accompanied by changes in the amount of grass available to elephants during the wet season. • Changes in the δD of hair are well correlated with the isotopic composition of local drinking water. • The minimum value for δD occurs at essentially the same time as the peak NDVI. • Tail hair of wild animals represents an archive of dietary behavior that provides an opportunity to quantify diet and the environmental conditions experienced by those animals.
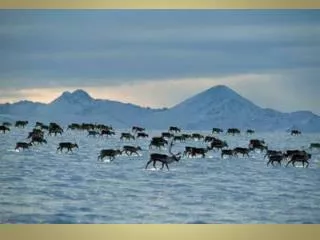
Example 2: Sockeye Salmon Nature, 2002 Photo Credit: Thomas Quinn
Example 2: SockeyeSalmon Oligo-meso taxa Oligotrophic taxa Eutrophic indicator
Example 2: Sockeye Salmon The abrupt reduction in δ15N at 100 BC roughly coincides with a major cultural change associated with transition from Early to Late Kachemak. The increase in δ15N from 800 - 1200 AD matches the change from late Kachemak to Koniag period – a time when human populations rose and began to utilize more salmon. Frazer Lake serves as a reference lake – obstructed by a steep waterfall, it had no salmon before the 1950’s.
Example 2: Sockeye Salmon From AD 300 – AD 1200, sardines and anchovies were more abundant when Alaskan sockeye stocks were much weaker than average; this trend is reversed for the past 800 years. Long-term trends reported here are distinct from the pattern seen in historical records – sardines covary with salmon but are out of phase with anchovies. Suggests that multiple modes of variability in ocean-atmosphere circulation and ecosystem dynamics operate in the N. Pacific.
Example 3: American Redstarts Photo Credit: Arthur Morris Science, 2004
Example 3: American Redstarts • Important points: • Warbler • Breeds in Ontario • Migrates to the Caribbean • Only grow tail feathers • once a year (in the fall) 2 Year Study: Year 1) Color band male birds; measure parental care – males that lost nests to predators didn’t have to work as hard (no chicks to feed); track their fall migration departure time. Year 2) Recapture all returning banded males; pluck tail feathers; measure δD to determine at what latitude the feather was grown; measure the feather color – how orange?
Example 3: American Redstarts RESULTS Birds that did not work as hard the previous year molted before migration (δD values were very negative) and were also very vibrantly colored. • Birds that worked hard (i.e. raised chicks) molted during migration (δD values were less negative) and were less vibrantly colored. • Why would color be less vibrant? Maybe poor food quality? Tired?
Example 4: Bats Goal: To examine δD values of hair in four bat species in the eastern US and test the assumption of a clear relationship between modeled δDprecip or latitude (LAT) and δDhair. Two questions: Is there significant intraspecific variation in the relationship between δDh and LAT or δDp based on age or sex? Is there significant interspecific variation? 4 bat species: 1 long-distance migrant, 3 regional migrants. Photo: Smithsonian Myotis sodalis Photo: Merlin D. Tuttle Lasiurus borealis
Example 4: Bats Found strong relationship between dDh and LAT for two species: M sodalis and M. septentrionalis. However, dDp and LAT explain very little of the variance in the two other species: M. lucifugus and L. borealis. -expect to see the relationship between dDp and dDh break down if precipitation is not the primary source of hydrogen to the food web used by bats (e.g. lake environment) – M. lucifugus. -expect timing and duration of molt to also be responsible for blurring the relationship between dDh and dDp.