Download
1 / 15
170 likes | 434 Views
Biodiversity, Keystone species, Energy flow (chains, webs, pyramids). Changing one factor in an ecosystem can affect many other factors…. Biodiversity – the variety of living things in an ecosystem

E N D
Biodiversity, Keystone species, Energy flow (chains, webs, pyramids)
Changing one factor in an ecosystem can affect many other factors… • Biodiversity – the variety of living things in an ecosystem amount of biodiversity depends on many factors – many of these are abiotic (moisture levels, temp)
Keystone species Not all species play equal roles in ecosystems • KEYSTONE SPECIES: organism population that can be very important in keeping an ecosystem in balance -- removing them from the ecosystem would cause drastic changes. • If a keystone species goes extinct, populations of other organisms might increase, decrease, or disappear altogether. Ex. Sea otter, prairie dog The classic tale of a keystone species is that of the sea otter, which was once
The story of the sea otter… • West Coast of North America • European and Russian trappers hunt sea otters to near extinction in the 18th and 19th centuries. • sea otters numbers decline, allows sea urchin populations to explode. • sea urchins feast on and wipe out kelp beds, which are critical habitat for spawning fish. • Fish begin to decline for lack of spawning habitat; this affects fishermen's catches. • Finally, an international treaty is enacted to protect sea otters. • In areas where the otters recovered, urchin populations are once again kept down, the kelp beds recover, fish nurseries recover, and fish catches rise again.
Nutrition and Energy Flow • Sunlight is the main energy source for life on earth – PHOTOSYNTHESIS • Autotrophs vs. Heterotrophs -autotrophs make own food -heterotrophs must consume another organism in order to get nutrition *herbivores (primary consumers) *carnivores (secondary and upper level consumers) -scavengers *omnivores (primary, secondary, and upper level consumers) -decomposers
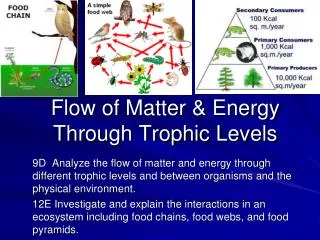
Matter and Energy Flow in Ecosystems • Energy flows through organisms in an ecosystem. IT DOES NOT RECYCLE! • Matter is neither created nor destroyed, it CYCLES • Scientists use models to represent these pathways. 2 models: food chains and food webs *food webs are made up of many interwoven food chains…
Food Chains • Nutrients and energy move from autotrophs to heterotrophs to decomposers… • Food chains are drawn with arrow pointing in direction of energy flow – org that consumes will have “mouth” to eat food source. grasshopperrobin robingrasshopper • Food chains can be made up 3 links, but seldom have more than 5 due to loss of energy as heat.
Food Webs • Made up of interlocking food chains • Organisms that can use MULTIPLE sources of things for food are more likely to survive… african grassland food web formation
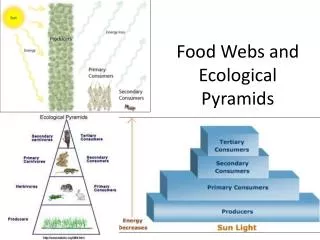
Food chains con’t • Each organism in the chain represents a feeding step or TROPHIC LEVEL • Can be represented by ecological pyramids Top carnivores carnivores Herbivores Producers
3 types of Pyramids to know: • Pyramid of Numbers • Pyramid of Energy • Pyramid of Biomass
Pyramid of numbersShows the relativenumber of individualorganisms at eachtrophic level.
Energy Pyramid –Pyramid of energy:Shows the relative amount of energy available at each trophic level. Organisms use about 10 percent of this energy for life processes. The rest is lost as heat. Will usually be indicated by kcal
The 10% Rule of energy tranfer… • How much energy is lost from one level to the next? • Scientists say that on average 90% of the available energy is used for life processes such as respiration, photosynthesis, and reproduction and is transformed to heat energy before an organism is consumed. • This means only about 10% of the original energy is left to feed the next level. • This 10% is stored in the tissues (leaves, stem, muscles, organs, fat, etc.) of the organism.
Pyramid of BiomassRepresents the amount ofliving organic matter at each trophic level. Typically, thegreatest biomass is at the base of the pyramid.