Download
1 / 22
220 likes | 231 Views
FORECASTING ENERGY PRODUCT PRICES. M.E. Malliaris Loyola University Chicago S.G. Malliaris Massachusetts Institute of Technology. The Problem. Forecasting 5 interrelated energy products using price data from all five of them Crude Oil [CO] Heating Oil [HO] Gasoline [HU]

E N D
FORECASTING ENERGY PRODUCT PRICES M.E. Malliaris Loyola University Chicago S.G. Malliaris Massachusetts Institute of Technology
The Problem • Forecasting 5 interrelated energy products using price data from all five of them • Crude Oil [CO] • Heating Oil [HO] • Gasoline [HU] • Natural Gas [NG] • Propane [PN]
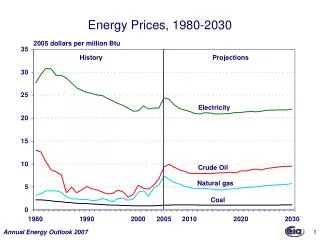
ORIGINAL DATA • Daily spot prices for each of the five variables from December 1997 through November 2002 [5 years] • The first four years were used for the training set • The last year was used for validation
Variables Inputs • Daily closing price of the 5 products • Percent change in price from previous day • Standard deviation over 5 previous days • Standard deviation over 21 previous days Output • Daily price 21 trading days away
MODELS • Multiple Regression • K-Means clustering (cluster group used as additional input into the neural network) • Neural Network
TOOLS • Excel • Multiple Regression • SPSS Clementine • Cluster Analysis • Neural Networks
Variables Used • The number of variables used in each of the final regression models ranged from 9 to 14 • Only NG appeared in every regression model • The most significant variables in the NN models had little agreement among them • The CL model had no variable in the top five in common with any other model’s top five
Some Conclusions • In some cases, there is enough information contained in a simple set of price data to allow effective forecasting • The ability to predict the price of a source good does not imply an ability to predict the price of that good’s byproducts