Download
1 / 36
360 likes | 478 Views
School Functioning Over Time for Students Served in a System of Care. Jeffrey A. Anderson Indiana University . Setting the stage…. Educational Characteristics of Students Served in Systems of Care: A National Perspective. Hypotheses.

E N D
School Functioning Over Time for Students Served in a System of Care Jeffrey A. Anderson Indiana University
Setting the stage…. Educational Characteristics of Students Served in Systems of Care: A National Perspective
Hypotheses • Improved school functioning will be associated with improved clinical functioning over time • Demographic characteristics will not be associated with changes in school functioning • Students without special education labels will outperform students with special education labels in terms of school functioning
Theoretical Underpinnings • MH/Social needs interfere with learning • Schools not designed for such challenges • SOCs provide support 24/7 • SOC Teams can offer support for: • Attendance • School behavior • Academic achievement
Setting: The Dawn Project • Founded in 1997, Indianapolis, Indiana • Administered by nonprofit care management organization, Choices, Inc. (https://www.choicesteam.org/page/home/) • SOC teams provide service coordination and wraparound • Students referred considered to have most difficult emotional and behavioral challenges • Involved in more than one system • Served 1000 students to date
Data • Interviews with caregivers (and students) • Conducted at enrollment and 6 month intervals, up to 36 months
Outcome Educational Questionnaire • School functioning composite • School attendance • Grades • Discipline
Over Time Predictors • Behavioral and Emotional Rating Scale • Child Behavior Checklist • Child and Adolescent Functional Assessment Scale
Time Invariant Predictors • Special education status - at the time of enrollment • Demographics • Age • Sex • Race
Time How change occurs relative to number of months that have passed since entering the SOC Average length of stay is 14 months
Analytic Strategies • HLM: how clinical functioning impacts school functioning over time • how special education status and demographic characteristics impact these resulting patterns • Intercept (i.e., initial status) and rate of change (i.e., slope) are allowed to vary as function of individual characteristics
Instrumentation • BERS • less than 70: very poor strengths • 70 to 79: poor strengths • 80 to 89: below average • 90 to 110: average • 111 to 120: above • 121 to 130: superior • above 130: very superior strengths
Instrumentation • CAFAS • 0-10 minimal or no impairment • 20-40 mild impairment • 50-90 moderate impairment • 100-130 marked impairment • Above 140 severe impairment
Instrumentation • CBCL • Scores of 67 and above considered to be in clinical range
Instrumentation • School functioning (1-7) • 1-2 Very poor – likely not in school • 3 Attending school; minimal success • 4 Attending; below average fx • 5 Average school functioning • 6 Above average school functioning • 7 Very successful
School Fx equations (trimmed) Y = 1.27 + .04(time) - .02(SE)(time) +.03(BERS) Y = 8.21 + .50(SE) - .07(age) + .04(time) - .035(SE)(time) -.05(CBCL) Y = 6.58 + .48(SE) - .08(age) + .04(time) - .03(SE)(time) -.01(CAFAS)
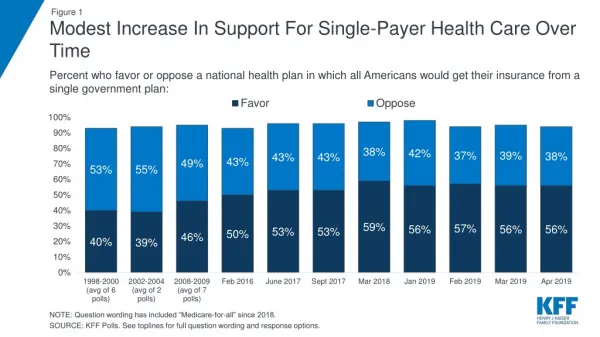
Average Level of School Functioning by Special Education Status, Time Point, & Clinical Score for Students (12.6 years old)
Discussion Hypothesis #1: School progress over time occurs and is associated with similar trends in clinical functioning • School functioning significantly increases from enrollment to 24 months (largest effect size during the first 12 months) • After controlling for time, each clinical measure explains an additional 7% to 9% of improvement
Discussion Hypothesis #2: demographics would not be associated with change over time, also was largely confirmed • Findings suggest that students tend to enter the Dawn Project with substantial challenges in impairment and functioning and low levels of strengths, and profit equally well from SOC involvement, regardless of gender, race, or age
Discussion Hypothesis #3: findings suggest differences in functioning between students with and without special education labels • After controlling for clinical functioning, students with special education labels have better school functioning at enrollment than students without labels; however, by 24 months, this finding is reversed
Limitations • Data come from one county level system-of-care • Data are self-report • SOC experiences that support or detract from school functioning were not examined Thus, these analyses should be viewed as preliminary
Conclusions 1. School functioning improves quicker while students are in the SOC (however, the trend continues beyond Dawn Project involvement). • How can we take advantage of this?
Conclusions 2. After controlling for the impact of time, each clinical measure explained an additional 7% to 9% of the improvements seen in school functioning over time • Target clinical and school challenges simultaneously [Do not wait until behavior is “stable”]
Conclusions 3. Scores from each clinical measure crossed a clinically significant threshold during the time period examined in this study; however,scores remain relatively “high” over time • Consider chronic v. acute challenges • Building long term support structures & capacity
Conclusions 4. Students tend to enter the DP with substantial challenges low levels of strengths, and profit equally well from their SOC involvement, without regard to gender, race, or age. • Being younger at enrollment is associated with better initial school functioning
Conclusions 5. After controlling for clinical functioning, students with special education labels appear generally to have better school functioning at enrollment than students without labels; however, this effect does not hold and by 24 months, students not in special education are outperforming their peers in special education.