Download
1 / 41
410 likes | 490 Views
Preliminary Evaluation of Data for Reasonable Progress. Montana RH FIP Laurel Dygowski, EPA Region 8 IWG Meeting – April 2007. Mandatory Class I Areas. Distribution of Aerosol Light Extinction for 20% Worst Days for Federal Class I Areas in Montana.

E N D
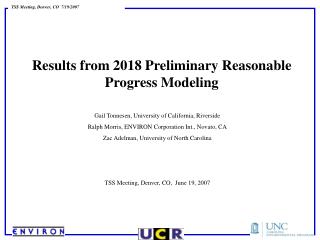
Preliminary Evaluation of Data for Reasonable Progress Montana RH FIP Laurel Dygowski, EPA Region 8 IWG Meeting – April 2007
Distribution of Aerosol Light Extinction for 20% Worst Days for Federal Class I Areas in Montana • Class I Areas in the west are dominated by organics. • Class I Areas in the northeast have a relative higher contribution from sulfates and nitrates
Monture (MONT1) - IMPROVE Monitor for – Bob Marshall, Mission Mountains, and Scapegoat – USFS Wilderness Areas
Improve Data – Baseline and Natural Conditions – Default Natural Conditions 2000-2004 baseline for worst days – 14.48dv Default Natural Conditions – 7.33dv
Improve Data – Baseline and Natural Conditions – New Equation • Natural Conditions with new equation – 7.74 • 6.74 deciview change to needed to reach natural conditions
Uniform Rate of Progress • EPA Region 8 plans on using new calculation of natural conditions (7.74dv) • 1.2dv reduction to be on glideslope for first five planning periods • .74 reduction in 6th planning period
Best and Worst Days - Trends • Best Days Average – 3.85 dv • Worst Days Average – 14.48 dv
Species Contribution Average over Baseline • Best Days – Organics and sulfates are highest contributors • Worst Days – Organics heavily dominate species contribution
Monture Light Extinction, Baseline and Estimated and Default Natural
Monture Controllable Light Extinction on 20% Worst Days for Base Period
CAMx PSAT Attribution of Nitrate at Monture for 20% Worst Days for Base Period
CAMx PSAT Sulfate Attribution at Monture for 20% Worst Days for Base Period (Excluding Boundary Conditions)
CAMx PSAT Attribution of Sulfate at Monture for 20% Worst Days for Base Period Note: If boundary condition sulfate comes from these categories, double the contribution of these categories. For example, Montana contributions would double from 6% to 12%. If, however, boundary conditions are indicative of natural and international impacts, the contributions shown may be indicative of the true impact.
CAMx PSAT Sulfate Attribution at Monture for 20% Worst Days for Base Period (Excluding Boundary Conditions)
Sources and Areas of Potential Sulfur Oxide Emissions Influence2018 Projections for UL Bend, MT20% Worst Visibility Days
Sources and Areas of Potential Nitrogen Oxide Emissions Influence2018 Projections for UL Bend, MT20% Worst Visibility Days
Sources and Areas of Potential Organic Carbon Emissions Influence2018 Projections for UL Bend, MT20% Worst Visibility Days
Sources and Areas of Potential Elemental Carbon Emissions Influence2018 Projections for UL Bend, MT20% Worst Visibility Days
Sources and Areas of Potential Fine PM Emissions Influence2018 Projections for UL Bend, MT20% Worst Visibility Days
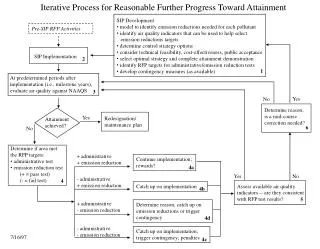
Oil & Gas Production & Distribution NOx Emissions 200,000 175,000 150,000 125,000 Tons/Year 100,000 75,000 50,000 25,000 - AZ ID SD AK UT CA NV ND CO OR MT WA NM WY Tribes 2002 2018 WRAP Region: 2002 Total = 365,000 and 2018 Total = 540,000 Area Sources – Oil and Gas Taken from WRAP POINT AND AREA SOURCE EMISSIONS PROJECTIONS FOR THE 2018 BASE CASE INVENTORY, VERSION 1
Emission Inventory and 2018 Projections • Oil and Gas – Only area source predicted to grow • Area source emission inventory much larger than point source • Most pollutants predicted to decline or grow only slightly • Decline in mobile sources
Emissions Inventory – Highest NOx Emitters The EI numbers are approximate and have not been verified by EPA
Emission Inventory – Highest SOx Emitters The EI numbers are approximate and have not been verified by EPA
Emission Inventory Non-BART Sources • NOx Stationary Sources • 2002 NOx – Approx 53,000 tons • 15 Sources – 81% of emission • 2005 – Approx 56,000 tones • 14 Sources – Approximately 85% of emissions • SOx Stationary Sources • 2002 Sox – approx. 37,000 tons • 14 Sources – 64% of SOx Emission • 2005 – Approx 24,357 tons • 14 Sources – Approximately75% of SOx Emissions
Non-BART Stationary Sources • Possible Approach Use Q/D for screening • Sources with Q/D > 10 • Q = NOx + SOx + PM (tons/year - PTE) • D = distance to nearest Class I area in km • Possibility of WRAP providing additional information on current and possible control measures for these sources • Use of other sources (i.e., permits) to determine current controls
Summary of Analysis for Reasonable Progress at Monture • Are there uncontrolled sources that are controllable?
Next Steps • Analyze data for other MT Class I areas • Evaluate contributing sources and source categories for possible controls • Do four factor analysis for identified sources and determine LTS • Consult with states Montana is affecting and that are being affected by Montana