Download
1 / 22
230 likes | 260 Views
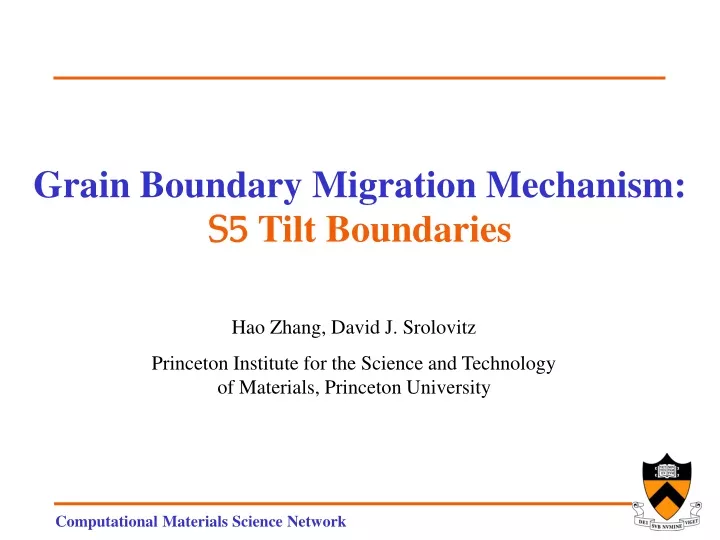
Grain Boundary Migration Mechanism: S5 Tilt Boundaries. Hao Zhang, David J. Srolovitz Princeton Institute for the Science and Technology of Materials, Princeton University. 11. 22. 33. Free Surface. 22. 11. q. 33. Grain 2. Z. Grain Boundary. X. Grain 1. Y. Free Surface.

E N D
Grain Boundary Migration Mechanism:S5 Tilt Boundaries Hao Zhang, David J. Srolovitz Princeton Institute for the Science and Technology of Materials, Princeton University
11 22 33 Free Surface 22 11 q 33 Grain 2 Z Grain Boundary X Grain 1 Y Free Surface Reminder: elastically driven boundary migration • Drive grain boundary migration with an elastic driving force • even cubic crystals are elastically anisotropic equal strain different strain energy • measure boundary velocity deduce mobility • Applied strain • constant biaxial strain in x and y • free surface normal to z iz = 0 • note, typical strains (1-2%) not linearly elastic • Measure driving force • apply strain εxx=εyy=ε0and σiz= 0 to perfect crystals, measure stress vs. strain and integrate to get the strain contribution to free energy • includes non-linear contributions to elastic energy S5 (001) tilt boundary
a a Symmetric boundary Asymmetric boundary a = 14.04º Asymmetric boundary a = 26.57º Reminder: Simulation / Bicrystal Geometry [010] S5 36.87º
Reminder: Mobility vs. Inclination • Mobilities vary by a factor of 4 over the range of inclinations studied at lowest temperature • Variation decreases when temperature ↑ (from ~4 to ~2) • Minima in mobility occur where one of the boundary planes has low Miller indices
Free Surface Z X Grain 2 Y Grain Boundary Grain 1 tilt axis Free Surface Approach • Look in detail at atomic motions as grain boundary moves a short distance • Focus on one boundary (a=22º), time = 0.3 ns, boundary moves 15 Å • For every 0.2 ps, quench the sample (easier to view structure) – repeat 1500X • X-Z (┴ to boundary) and X-Y (boundary plane) views – remember this Boundary Plane View Color - potential energy Trans-boundary Plane View
Interesting Observations 1 Boundary Plane - XY Atomic displacements: Dt=0.4ps, t=30ps Atomic displacements: Dt=5ps • Substantial correlated motions within boundary plane during migration
Interesting Observations 2 Trans-boundary plane XZ Atom positions during a period in which boundary moves downward by 1.5 nm Color – von Mises shear stress at atomic position – red=high stress • Regular atomic displacements – periodic array of “hot” points
Interesting Observations 3 Trans-boundary plane XZ Atom positions during a period in which boundary moves downward by 1.5 nm Color time – red=late time, blue=early time • Atomic displacements symmetry of the transformation
Coincidence Site Lattice • Part of the simulation cell in trans-boundary plane view • CSL unit cell • Atomic “jump” direction ▲,○ - indicate which lattice Color – indicates plane A/B Displacements projected onto CSL “Interesting” displacement patterns
4 1 3 2 5 Atomic Path for S5 Tilt Boundary Migration • Translations in the CSL • Types of Atomic Motions • Type I • “Immobile” – coincident sites -1 d1= 0 Å • Type II • In-plane jumps – 2, 4, 5 • d2=d4=1.1 Å, d5=1.6 Å • Type III • Inter-plane jump - 3 • d3=2.0 Å
Simulation Confirmation Trans-boundary plane XZ ○ initial average position projected on trans-boundary plane ∆ final average position came from the same atoms in initial Color – indicates plane A/B • The atoms that do not move (Type I) are on the coincident sites • Plane changing motions (Type III), are “usually” as predicted
Simulation Confirmation - Type III Displacements Boundary Plane - XY Trans-boundary plane XZ Atomic displacements: Dt=0.4ps, t=30ps Color – von Mises shear stress at atomic position • The red lines on the left ( XY-plane) indicate the Type III displacements • These are the points of maximum shear stress
The Big Questions • How are these different types of motions correlated? • which is the chicken and which is the egg? • What triggers the motions that lead to boundary translation? • Can we use this information to explain how mobility varies with boundary structure (inclination)?
4 1 3 2 5 3 3 1 1 2 2 4 4 5 5 1 Type III motion Boundary Plane - XY Transition Sequence Color- time blue- early time Trans-boundary plane XZ Colors Time Sequence is 1,3,4 then 2 + 5
Type II Displacements Trans-boundary plane XZ Atom positions during boundary moves downward by 1.5 nm Color – Voronoi volume change – red= ↑over 10%, blue = ↓over 10% • Excess volume triggers Type II displacement events
Connection with Grain Boundary Structure • The higher the boundary volume, the faster the boundary moves • More volume easier Type II events faster boundary motion
Type III Displacements Boundary Plane - XY Atomic displacements: Dt=5ps
Excess Volume Transfer During String Formation Boundary Plane - XY • Colored by Voronoi volume • In crystal, V=11.67Å3 • Excess volume triggers string-like (Type III) displacement sequence • Net effect – transfer volume from one end of the string to the other • Displacive not diffusive volume transport • Should lead to fast diffusion
Correlation with Boundary Self-diffusivity • Diffusivity along tilt axis direction is correlated with boundary mobility • Diffusivity along tilt axis – indicative of Type III events • Diffusivity much higher along tilt-axis direction than normal to it
How Long are the Strings? Boundary Plane - XY • Display atoms in 0.4 ps time intervals with displacements larger than 1.0 Å • Arrow indicates the direction of motion in the X-Y plane • 3 or 4 atom strings are most common • Some strings as long as the entire simulation cell • -10 atoms
4 1 3 2 5 Another Measure of Simulation Size Effect • What happens if we make the simulation cell thinner in the tilt axis direction? Sequence is 1,3,4 then 2 + 5 • Strings (Type III events) cannot be longer than simulation cell size • The boundary mobility drops rapidly for cell sizes smaller than 6 atom spacings (12 Å)
4 1 3 2 5 Migration Picture Atomic Path • A volume fluctuation occurs at the boundary • A Type II displacement event occurs • Triggers a Type III (string) event • Transfers volume • Boundary translation Transition Sequence 1,3,4 then 2 + 5