Download
1 / 11
110 likes | 301 Views
STAR. Identified Particle Measurements RHIC Beam Energy Scan. Abhilash Nair STAR Collaboration University of Illinois at Chicago. Beam Energy Scan at RHIC. Properties of matter created at 200 GeV are consistent with an expected 2 nd order phase transition

E N D
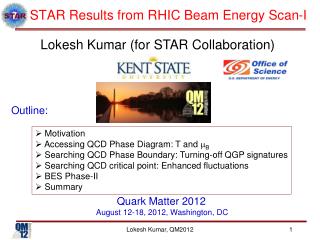
STAR Identified Particle MeasurementsRHIC Beam Energy Scan Abhilash Nair STAR Collaboration University of Illinois at Chicago
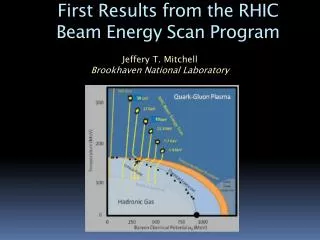
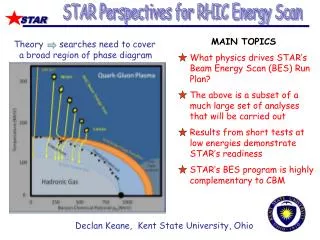
Beam Energy Scan at RHIC • Properties of matter created at 200 GeV are consistent with an expected2nd order phase transition • Beam Energy Scan (BES) at RHIC looks to experimentally find the critical point of 1st order phase transition predicted to exist at lower energies • STAR has collected data from the following collision energies (in decreasing energy order) : • 200, 130, 62.4, 39, 19.6, 11.5, 9, 7.7 GeV • This presentation aims to show the work-in-progress analysis of the 39 GeV data sample • Spectra shapes and particle ratios help connect collected data to observables that are expected to change in such a phase transition Simply a cartoon, does not represent actual experiential data
Time Projection Chamber (TPC) • The TPC is a barrel shaped detector consisting of a gas-filled chamber, magnet providing a strong uniform magnetic field, and an electric field between the center and endplates • We use measurements of the ionization energy loss (dE/dx) and momentum to identify particles
Event Selection • From Min-Bias Trigger • |Vz| < 30 cm • |Vr| < 2 cm • 10 M events pass cuts Track-Quality Cuts • |Dca| < 3 cm • NHitFits > 25 • NHitFits/NHitPoss > 0.51 Vertex Z Vertex Y [cm] Vertex X [cm]
2-D Particle-Centered Histograms dE/dx (Arb Units) p (GeV/c) π p K pT (GeV) pT (GeV/c) pT (GeV/c) Zπ Zk Zp Where superscript BB represents the expectation of dE/dx for a given particle i = ( π, K, p )
Gaussian Peak Fitting & Electron Contamination π+ π- K+ p K- e+ e- pbar Zk Zk Without constraints, e-/e+ peak positions will jump sharply over a relatively small pT range e-/e+ peak overlaps with nearby peaks in certain pT ranges During crossover, e-/e+ peak is not reliable without further constraints Zk
Estimate of E-/E+ Contamination dE/dx p K • For overlap areas we rely on extrapolated centroid positions and yields • This is done independently in each particle-centered histogram, and across different rapidity bins e π p (Gev/c) e+ Centroids e+ Yields [-0.1 < y < 0.1) [-0.1 < y < 0.1) dE/dx STAR Preliminary STAR Preliminary pT (GeV/c) pT (GeV/c)
Uncorrected Yields vs. mT-m0 [-0.1 < y < 0.1) [-0.1 < y < 0.1) [-0.1 < y < 0.1) π+ p Arbitrary Units Arbitrary Units Arbitrary Units K+ Arbitrary Units STAR Preliminary STAR Preliminary STAR Preliminary mT-m0 (GeV) mT-m0 (GeV) mT-m0 (GeV) [-0.1 < y < 0.1) [-0.1 < y < 0.1) [-0.1 < y < 0.1) Arbitrary Units π- K- pbar Arbitrary Units Arbitrary Units STAR Preliminary STAR Preliminary STAR Preliminary mT-m0 (GeV) mT-m0 (GeV) mT-m0 (GeV)
Uncorrected Antiparticle to Particle Ratios • Cannot make a physics conclusions without corrections, which include: • Single Particle Efficiency • Energy Loss Correction • Acceptance • Proton Background [-0.1 < y < 0.1) [-0.1 < y < 0.1) [-0.1 < y < 0.1) π- / π+ K- / K+ pbar / p Arbitrary Units Arbitrary Units Arbitrary Units Efficiency, absorption, &background uncorrected Efficiency, absorption, &background uncorrected Efficiency, absorption, &background uncorrected STAR Preliminary STAR Preliminary STAR Preliminary mT-m0 (GeV) mT-m0 (GeV) mT-m0 (GeV)
Proton Background: DCA Plots dN/d(dca) [cm^-1] Phys. Rev. C 79 (2009) 34909 200 MeV < pT < 300 MeV STAR Preliminary Phys. Rev. C 79 (2009) 34909 Dca [cm] DCA plot courtesy of Alex Brown (UIC)
Future Outlook • Our work-in-progress min-bias π+/π- ratio at 39 GeV is similar to results from 19 GeV & 200 GeV • Plans for the future include: • Efficiency Corrections • Proton Background • Energy Loss Corrections • Investigate Rapidity Dependence • K/Pi, p/Pi • Integrated Yields & Ratios [-0.1 < y < 0.1) π+ / π- Arbitrary Units Efficiency, absorption, &background uncorrected STAR Preliminary mT-m0 (GeV)