Download

1 / 74
740 likes | 918 Views
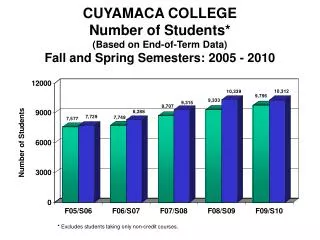
Enrollment Update | Fall 2009. Founded 1870 | Rolla, Missouri. Total Enrollment Fall 2000-Fall 2009 47% Enrollment Growth: 2,189 Additional Students. Increase enrollment and manage the academic portfolio: .

E N D
Enrollment Update | Fall 2009 Founded 1870 | Rolla, Missouri
Total Enrollment Fall 2000-Fall 200947% Enrollment Growth: 2,189 Additional Students
Increase enrollment and manage the academic portfolio: • Missouri S&T will increase its enrollment by improving access, expanding diversity, increasing retention, expanding extended learning activities, controlling tuition, and providing more endowed scholarships. • Missouri S&T will balance the academic portfolio and the student experience by increasing market share in areas such as life sciences and biotechnology, energy, business and management, communication, the liberal arts, and education in science, technology, engineering and mathematics.
Strategic Enrollment Management Plan 2007-2011 Increase Success of Students • Retention Rates • Graduation Rates Increase College Going Rate & Access • Access & Affordability • Pipeline of College Ready Students • Strategic Partnerships • Outreach/Education • Scholarships Expanding Current Markets & Capturing New Markets • Out-of-state students • Transfer Students • Female Students • Underrepresented Minority Students • International Students • Graduate Students • Nontraditional Students
2001-2009 Enrollment Change • 41% Increase in Undergraduates (1507) • 41% Increase in Female Students (+435) • 73% Increase in Graduate Students (+682) • 91% Increase in Minority Students (+342) • 40% Increase in Non-Engineering Majors • Since 2005, 60% of Growth due to Increased Retention Rates • 87% to 88% Retention Rate Achieved and Sustained • 62% Graduation Rate Achieved. 65% possible by 2010 • Lower discount rate from +38% to 27% • Generated over $21 M in additional gross revenues
An IDEAL Missouri S&T freshman class 990 to 1030 students with the following profile: Academic Preparedness: 27 average ACT score (upper 10% in nation) 90% having completed the full Missouri college-prep curriculum 50% from the upper 20% of high school class Geography: 70% in-state 25% out-of-state 5% international Gender: 30% female 70% male Ethnicity:13% under-represented minority students Majors: 70% Engineering (all programs) 5% Liberal Arts (psychology, history, English, technical communication, philosophy) 8% Business, Information Technology and Economics 9% Natural Sciences and Mathematics (biology, chemistry, physics) 8% Computer Science Success Rate:90% first to second year retention rate 80% return for third year 65-70% graduate in six years
S&T Miners Aren’t Your “Average Joe” • 52 National Merit Scholars • 80% ranked in the top 30% of their high school class • 71 Valedictorians & Salutatorians • Average ACT of 27.7 (upper 10% in nation) • +70% have over 13 hours college credit • 895 Bright Flight Scholars* • 1,426 Access Missouri Scholars* • Mid-range ACT score of 26-31* *All students
silver bullet or strike of lightening?
the truth is………. silver buckshot: +92 strategic institutional, policy, market, facility and program changes.
What is SEM? Strategic Enrollment Management (SEM) is defined as “a comprehensive process designed to help an institution achieve and maintain the optimum recruitment, retention, and graduation rates of students where ‘optimum’ is designed within the academic context of the institution. As such, SEM is an institution-wide process that embraces virtually every aspect of an institution’s function and culture.” Michael Dolence, AACRAO SEM 2001 • Research • Recruitment • Retention
Core Enrollment Principles • No Enrollment Effort is Successful without QUALITY Academic Programs to Promote • Recruitment and Retention is an On-going, Multi-year PROCESS with Strong Access to Research and DATA • +80% of Enrollments come from REGIONAL student markets for BS/BA degrees • The Most Successful Recruitment Programs Clearly DIFFERENTIATE the Student Experience from Competitor’s Programs • The Most Successful Retention Programs Clearly Address Students’ Needs and Regularly ENGAGE Students in Academic and Non-Academic Programs
Pricing Institutional Research Strategic Planning Admission & Recruitment Academic Policies Housing Alumni and Development Teaching & Learning Mental Health Services Campus Life Social Support Programs Assessment of Student Learning Student Success Academic Support Programs Career Planning Institutional Policies External Engagement Marketing Institutional Effectiveness Records and Registration Financial Aid Budgeting Academic Programs Chart Adapted from: Bob Wilkinson
Stabilizing Enrollments Reducing Vulnerabilities Aligning EM with Academic Programs Stabilize Finances Optimize Resources Evaluate Strategies and Tactics Improve Services Improve Quality Improve Access to Information SEM Strategies
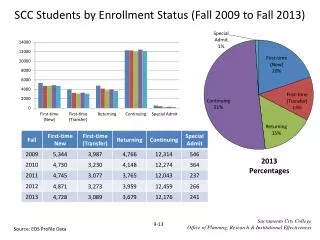
Total Enrollment Fall 2000-Fall 2009 47% Total Enrollment Growth: 2000: 4,626 2009: 6,815 41% Undergraduate Growth: 1,507 Additional Students 73% Graduate Growth: 682 Additional Students
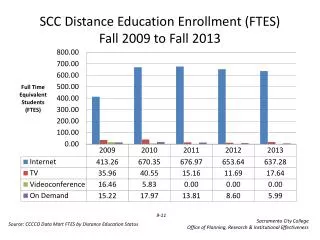
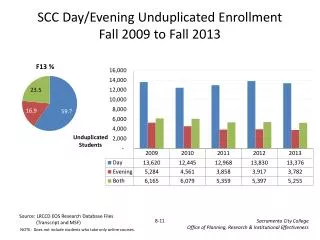
Campus and Distance/Online Enrollments Fall 2000-Fall 2009 40% Growth of Campus Enrollment: 1761 Additional Students 184% Growth of Distance Enrollment: 428 Additional Students
Total Female Students Enrolled F’00-F’0941% Increase: 424 Additional Female Students
Under-Represented Students F’00-F’09118% Increase 295 Additional Students
20,000 fewer potential engineering majors College Bound ACT Tested Students Interested in Any Engineering Field > 5% SOURCE: ACT EIS 2008
Missouri’s 2008 student funnel for ALL engineering fields • High School Seniors: 72,467 • High School Graduates: 61,752 • ACT Testers/College Bound: 47,240 • Any Engineering Interest (all testers): 1,768 • Any Engineering Interest, (+21 testers): 1,256 (21 = MO average score / 50%) • Engineering Interest, +24 comp. score: 961 (24 = UM minimum for auto admission) • Missouri S&T Freshmen Engineering 681 Enrollees: 71% S&T market share SOURCES: MODESE 2009, ACT EIS 2008, PeopleSoft
Growth by Academic GroupingsFall 2000 – Fall 2009 • Engineering = • AERO • ARCH • CERAMIC • CHEMICAL • CIVIL • COMPUTER • ENG MECH • ENG MGMT • ELECTRICAL • ENVIRNMTL • FRESHMAN • GEOLOGICAL • GEOTECH • IDE • MATERIALS • METALLURGY • MINING • NUCLEAR • PETROLEUM • SYSTEMS 60% INCREASE
Growth by Academic GroupingsFall 2000 – Fall 2009 • Business & Computing = • MBA • BUS&MS • COMP SCI • IST • Math & Natural Sciences = • BIOLOGY • CHEMISTRY • GEOLOGY • MATH • PHYSICS 51% INCREASE 42% INCREASE
Growth by Academic GroupingsFall 2000 – Fall 2009 • Liberal Arts = • ENGLISH • HISTORY • TECH COMM • PHILOSOPHY • SocialSciences = • ECONOMICS • PSYCHOLOGY 52% INCREASE 5% DECREASE
Growth by Academic GroupingsGRADUATE ONLY Fall 2000 – Fall 2009 • Engineering = • AERO • ARCH • CERAMIC • CHEMICAL • CIVIL • COMPUTER • ENG MECH • ENG MGMT • ELECTRICAL • ENVIRNMTL • FRESHMAN • GEOLOGICAL • GEOTECH • IDE • MATERIALS • METALLURGY • MINING • NUCLEAR • PETROLEUM • SYSTEMS TOTAL ENGINEERING: 97% INCREASE 18% INCREASE 713% INCREASE
S&T’s Global Presence Blue = S&T Alumni Green = Current Students Red = MOA universities
Students’ Home States Fall 2009 +25 students 10-24 students 1-9 students 48 2 2 1 6 2 2 23 3 2 14 15 21 3 2 16 RI 6 32 22 38 5 30 13 5 441 3 26 28 4 2 DC 48 4,673 126 19 15 13 14 19 51 64 4 7 Total Enrollment • 49 states & 51 nations • 73% Missouri residents • 11% minority students • 12% international students 7 22 22 128 10 6 17 2
% Change in EnrollmentsFall 2006 - Fall 2009 4.3 100 71.4 0 50 33 33 15.0 25 60 40 36.4 90.9 50 80 0 RI 39.1 46.7 11.6 20 150 87.5 85.7 150 15.7 200 52.9 64.7 0 2 DC 14.3 25.4 1.6 26.7 36.4 25% or greater 10% – 24.9% 5% – 9.9% 4.9% – -4.9% -5.1% – -9.9% -10% – -24.9% -25% or greater 333 22.2 46.2 10.5 5.9 100 40 0 15.8 120 29.3 16.7 100 41.7 100
SCHUY- LER LIVING- STON MONT- GOMERY ST CHARLES ST LOUIS ST GAS- LOUIS CITY CON- ADE JEFFER- SON WASHING- STE TON GENEVIEVE CAPE GIRARDEAU BOLLIN- GER MISSIS- SIPPI NEW MADRID PEMI- SCOT Students’ Home Counties SCOT-LAND PUTNAM WORTH MERCER 1 1 3 CLARK 1 ATCHISON 0 4 HARRISON NODAWAY 0 GENTRY 2 8 SULLIVAN ADAIR KNOX LEWIS 12 GRUNDY 4 3 4 7 +50 students 30-49 students 10-29 students 1-9 students 0 students HOLT 2 1 DAVIESS ANDREW DE KALB LINN MACON 6 8 MARION 3 SHELBY 6 11 23 8 4 23 CALDWELL CLINTON 2 RALLS BUCHANAN 7 CHARITON 9 MONROE CARROLL RANDOLPH 1 PIKE 3 8 RAY 1 PLATTE 13 CLAY 13 70 AUDRAIN 110 11 HOWARD SALINE LINCOLN 8 BOONE LAFAYETTE 50 5 16 JACKSON 74 295 COOPER CALLAWAY 15 7 WARREN 34 35 470 JOHNSON PETTIS 24 1,119 23 MONITEAU CASS 122 50 6 COLE OSAGE 81 FRANKLIN HENRY 17 MORGAN 20 9 153 6 BENTON 200 BATES MARIES MILLER 7 21 7 23 CAMDEN ST. CLAIR CRAWFORD 37 41 5 PHELPS HICKORY 35 16 VERNON 323 2 PULASKI 24 PERRY 11 170 ST FRANCOIS 11 CEDAR IRON DALLAS 6 DENT LACLEDE 38 POLK 11 23 6 MADISON BARTON 16 14 3 REYNOLDS 4 DADE 80 3 TEXAS WRIGHT WEBSTER 7 GREENE 26 JASPER 18 7 158 46 SHANNON WAYNE SCOTT 2 9 LAWRENCE 8 CARTER 14 DOUGLAS CHRISTIAN NEWTON STODDARD 5 3 19 48 14 3 BUTLER HOWELL RIPLEY STONE 15 OREGON OZARK 23 BARRY 10 4 MCDONALD TANEY 2 11 9 6 19 4 Fall 2009 10 4 DUNKLIN
SCHUY- LER LIVING- STON MONT- GOMERY ST CHARLES ST LOUIS ST GAS- LOUIS CITY CON- ADE JEFFER- SON WASHING- STE TON GENEVIEVE CAPE GIRARDEAU BOLLIN- GER MISSIS- SIPPI NEW MADRID PEMI- SCOT % Change in EnrollmentsFall 2005 - Fall 2009 SCOT-LAND PUTNAM WORTH MERCER 50 0 25 CLARK 66.7 ATCHISON 100 300 HARRISON NODAWAY 0 GENTRY 100 0 SULLIVAN ADAIR KNOX LEWIS 10.1 GRUNDY 100 200 133.3 0 25% or greater 10% – 24.9% 5% – 9.9% 4.9% – -4.9% -5.1% – -9.9% -10% – -24.9% -25% or greater HOLT 33.3 66.7 DAVIESS ANDREW DE KALB LINN MACON 0 166 MARION 200 SHELBY 14.3 37.5 11.5 100 33.3 4.2 CALDWELL CLINTON 100 RALLS BUCHANAN 36.4 CHARITON 125 MONROE CARROLL RANDOLPH 75 PIKE PLATTE 0 33.3 RAY 66.7 45.8 44.4 CLAY 44.4 AUDRAIN 46.7 26.7 HOWARD SALINE LINCOLN 33.3 BOONE LAFAYETTE 31.6 16.6 6.7 JACKSON 23.3 29.6 COOPER CALLAWAY 25 133 WARREN 100 29.6 36.2 JOHNSON PETTIS 243 21.8 9.5 MONITEAU CASS 171.1 35.1 33.3 COLE OSAGE 3.6 FRANKLIN HENRY 13.3 MORGAN 4.8 12.5 41.7 20 BENTON 14.9 BATES MARIES MILLER 600 4.5 133 17.9 CAMDEN CRAW-FORD 2.4 ST. CLAIR 8.4 25 PHELPS HICKORY 14.6 14.3 VERNON 3.2 0 PULASKI 100 PERRY 10 0.7 ST FRANCOIS 10 CEDAR IRON DALLAS 14.3 DENT LACLEDE 4.2 POLK 22.2 4.5 25 MADISON BARTON 23.1 62.5 180 REYNOLDS 66.7 DADE 33.3 0 TEXAS WRIGHT WEBSTER 75 GREENE 23.8 JASPER 28.6 133 17 6.1 SHANNON WAYNE SCOTT 50 55 LAWRENCE 33.3 CARTER 7.7 DOUGLAS CHRISTIAN NEWTON STODDARD 28.6 57.1 18.8 2 55.6 50 BUTLER HOWELL RIPLEY STONE 44.4 OREGON OZARK 15 BARRY 42.9 33.3 MCDONALD TANEY 60 8.3 35.7 0 111 300 9.1 0 DUNKLIN
46%: The Economy Has Changed Which College Students will Attend SOURCE: Longmire & Company, Inc. 2009 “Study of the Impact of the Economy on Enrollment”
76% indicated they would be “somewhat” or “very likely” to consider a more expensive institution if it could deliver greater value. SOURCE: Longmire & Company, Inc. 2009 “Study of the Impact of the Economy on Enrollment”
Key changes in the college-bound student markets • The Midwest and Northeast will experience a 4% to 10% decline in high school graduates between 2009 – 2014 (WICHE) • The profile of college-bound students is rapidly becoming more ethnically diverse and female dominant (NCES, WICHE, ACT, College Board) • The number of students interested in engineering, computer science, and natural science degrees has declined to record lows (ACT, CIRP) • More full-time college freshmen are choosing to start at two-year colleges (IPED, MODHE) • More students are enrolling in more than one college at a time (National Student Clearinghouse) • Future student market growth will include more students requiring financial aid and loans to complete a degree (WICHE)
National vs. regional trends WICHE, 2008
Projected change in high school graduates 2007-2017 +1 -17 -15 -23 -3 -19 +4 -14 -6 +13 -8 -8 -12 -14 -6 -6 -6 -12 -6 -3 -2 +53 -6 +10 -2 +9 -4 +27 -6 +21 -5 +1 +1 -3 +2 -31 +14 -1 +27 +1 +2 +1 -8 0 +22 0 > 20% +11% to +20% 0% to +10% Decreases -7 +16 +10 -9 -14 Source: Chronicle of Higher Education Almanac 2006-07
% change in Missouri general population by county 2000-2008 Missouri Average = 5.6% -14.4% - -0.1% 0% - 4.9% 5% - 9.9% 10% - 19.9% 20% - 39% Source: USDA, Bureau of the Census Published by: University of Missouri Extension, April 2 2009
By 2012, Missouri will have 4,000 fewer high school graduates each year
College-going rates continue to fall WICHE, 2008