Download
1 / 28
330 likes | 470 Views
Economics of Renewable Resources. Fisheries. Slides based on Costello, UCSB. Readings. Oil & Gas (last week) Tietenberg, chapters 7-8 In class handout Fisheries Tietenberg, chapter 13 In class handout. Renewable Resources. Examples Fisheries (chapter 13) Forests (chapter 12)

E N D
Economics of Renewable Resources Fisheries Slides based on Costello, UCSB
Readings • Oil & Gas (last week) • Tietenberg, chapters 7-8 • In class handout • Fisheries • Tietenberg, chapter 13 • In class handout
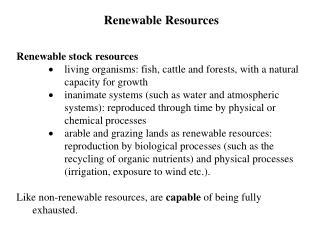
Renewable Resources • Examples • Fisheries (chapter 13) • Forests (chapter 12) • Livestock (chapter 11) • Characteristics • Natural growth • Carrying Capacity • What makes fisheries special enough to merit a separate chapter?
Some terms we will use • Stock – total population or biomass • Natural growth rate – biologic term • Harvest – how many are extracted (flow) • Effort – how hard fisherman try to harvest (economic term)
Simple Model of Fish Biology • Exponential growth • Crowding/congestion/food limits • Carrying capacity: point, k, where stock cannot grow anymore: x ≤ k • Resource limitations, spawning location limitations Stock, x t k x t
Put growth and drag together • Initial Growth is Exponential • Eventually tapers off • This graph is biomass against time • What does a graph depicting the growth of fish as a function of biomass look like? • Is this model a reasonable approximation of biology? Biomass (x) x time
“Carrying Capacity” xMSY Put growth and drag together Biomass (x) x time Stock that gives “maximum sustainable yield”
“Carrying Capacity” xMSY Interpreting the growth-stock curveCurve AKA: “stock –recruitment”; “yield-biomass” Growth rate of population depends on stock size low stock slow growth high stock slow growth x
Introducing Harvest • Suppose that we want to adopt a policy of harvesting the same amount every year • Simplifies problem – we only choose one number, instead of a value that might vary by year. • Allows us to think of the problem in terms of sustainability • In class assignment • Take home assignment (Greater Tuna) • Print and turn in page from your last round of play
Introduce harvesting H1 (# new fish per Year) H2 H3 x xc xa xb H1: nonsustainable extinction H2: MSY – consistent with stock size Xb H3: consistent with two stock sizes, xa and xc xa is stable equilibrium; xc is unstable. Why?
Introduce humans q = technology “catchability” E = effort (e.g. fishing days) x = biomass or stock • Harvest depends on • How hard you try “effort” (E) • Technology (q) • Stock size (x) • H = E*x*q • Implication: If the stock is depleted, you need more effort to catch the same harvest than you would with a healthy stock. • Question: Given costly effort, is “maximum sustainable yield” the efficient solution? • Additional Assumptions: • Marginal cost of effort = constant • Price of fish constant (fishery small part of world market) x
Finding Efficient Harvest • First step: Describe the relationship between harvest and effort in a sustainable model. • For any given E and q, what harvest level is just sustainable? • This is a differential equation that needs solving for x – solution yields H(E) Where q*E*x = = H
H(E) E “Yield-effort curve” • Gives sustainable harvest as a function of effort level • Looks like recruitment-stock graph, but is different (though it comes from recruitment-stock relation.) • Low effort → high stock • Tietenberg describes this curve as the “benefits” of fishing (assuming constant price for fish) • What form does costs as a function of effort take?
Introduce economics • Costs of harvesting effort • TC = w*E • w is the cost per unit effort • Revenues from harvesting • TR = p*H(E) • p is the price per unit harvest • Draw the picture
TC=w*E TR=p*H(E) E Efficient Fishery $ • We have now derived total benefits (revenues) and total costs as a function of effort. • Profit maximization occurs where MR = MC • Draw MR, MC E*
Effort in an Efficient Fishery $ Rents to the fishery TC=w*E • Optimal harvest = E* • E*< EMSY • Explain intuitively • At E*, firms earn profits (rents). • What is the competitive (common access) solution? TR=p*H(E) E $/E MR AR w MC=AC E* E EMSY
Effort in an Common-Access Fishery $ Rents to the fishery TC=w*E • As long as profits exist, firms entry • Zero profits when TR=TC • EOA > EMSY • Why must this be inefficient? TR=p*H(E) E $/E MR AR w MC=AC EOA EMSY E E*
Open access resource • Economic profit: when revenues exceed costs (not accounting profit) • Open access creates externality of entry. • I’m making profit, that attracts you, you harvest fish, stock declines, profits decline. • Entrants pay AC, get AR (should get MR<AR) • So fishers enter until AR = AC ( TR = TC) • In our example, even open access is sustainable • Though not socially desirable • What is social value of fish caught in open access fishery? • Zero: total value of fish = total cost of catching them
Illustration of equilibria Sustainable Catch Maximum Sustainable Yield ○ ○ Efficient Catch ○ Note: efficient catch lets biology (stock) do some of the work! Open Access Catch (Either side of MSY) X
Example: NE Lobster Fishery • Bell (1972) used data to determine catch (lb. lobsters) per unit of effort (# traps), using 1966 data • Open access equilibrium: TC = TR • E = 891,000 traps; H = 25 million lbs. • Compare to actual data: E=947,000; H=25.6 million lbs. • Maximum Sustainable Yield • EMSY = 1,000,000 traps; MSY=H=25.5 million lbs. • Efficient equilibrium • E*=443,000 traps; H*=17.2 million lbs. • See Tietenberg, example 13.4 for description of a second study with similar results.
Limiting the season or otherwise making fishing more difficult (e.g., “unreasonable” restrictions on equipment or very short open seasons) Example: very short seasons “hectic race” as fishermen fish harder during permitted times Increased bycatch high processing and storage costs injury or death for the fishermen Solutions to the “Tragedy of the Commons” Slides from here to end of lecture based on Woodward, TAMU
Benefits and Costs of Fishing Effort ($’s) Costs after Tax Costs Waste Revenue Ee Em Ec Quantity of Fishing Effort
Limiting the season or otherwise making fishing more difficult Taxing effort Solutions to the “Tragedy of the Commons”
Benefits and Costs of Fishing Effort ($’s) Costs after Tax Costs Tax Revenue Revenue Ee Em Ec Quantity of Fishing Effort
Limiting the season or otherwise making fishing more difficult Taxing effort Establishing common ownership over the fishery Fishery cooperatives 200 mile limit Individual transferable quotas Solutions to the “Tragedy of the Commons”
Individual Transferable Quotas (ITQ) 3 Features (Tietenberg) • Quota entitles holder to catch specified quantity (share) of fish. • Total quota amount = efficient harvest • Quotas should be freely transferable (fisherman have the right to buy or sell)
Why Transferability? • Allows most efficient fishermen to obtain quotas. • Allows fishermen to choose the optimal scale of operation. • Encourage technological progress • Distribution of quotas allows allocation of rents.
ITQs in Practice • New Zealand (Tietenberg, 300-301) • Need to revise limits • “By catch” of other ITQ regulated fish • “high grading” • US/Canada Scallops (Example 13.5) • US Halibut • Season increased from two 24-hr periods to over 200 days • Advocacy groups promote consuming this fish as an example of a well managed fishery