Download
1 / 14
140 likes | 332 Views
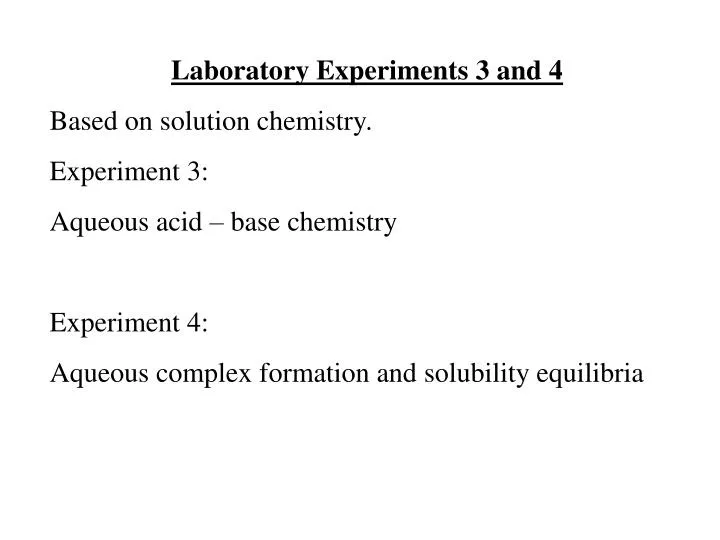
Laboratory Experiments 3 and 4 Based on solution chemistry. Experiment 3: Aqueous acid – base chemistry Experiment 4: Aqueous complex formation and solubility equilibria. Titration Curves strong base OH - (burette) vs. weak acid HAc (aliquot) K a = [H + ][Ac - ]/[HAc] and

E N D
Laboratory Experiments 3 and 4 Based on solution chemistry. Experiment 3: Aqueous acid – base chemistry Experiment 4: Aqueous complex formation and solubility equilibria
Titration Curves strong base OH- (burette) vs.weak acid HAc (aliquot) Ka = [H+][Ac-]/[HAc] and [H+] = Ka[HAc]/[Ac-] after each addition of OH- the equilibrium readjusts as [HAc] approaches 0 [H+] also approaches 0 and pH changes rapidly
pH titration NaOH vs. HAc end point pH 7 ½ way point 5 ΔpH/ΔV 4 V titre (mL)
The ½ way point At the ½ way point of the titration [HAc] = [Ac-] and [HAc]/[Ac-] = 1 since log (1) = 0 pH = pKa - log{[HAc]/[Ac-]} the H-H equation pH = pKa at the ½ way point The Ka values for weak acids and the Kb for their conjugates can be determined by a ‘simple’ titration.
Coloured End Point Indicators Some weak acids have different colours for their two forms HIn H+ + In- pH = pKa + log {[In-]/[HIn]} The solution colour depends on the pH. As the pH changes rapidly at the end point the solution colour changes rapidly. The Indicator is chosen so that it’s pKa value is close to the pH at the end point. In- HIn
Some indicator pKa values Indicator Use Colour change range pKa thymol blue 0.1 % in water red to yellow 1.2 - 2.8 1.7 methyl orange 0.1 % in water red to yellow 3.1 - 4.4 3.7 phenol red 0.1 % in water yellow to red 6.8 - 8.4 7.9 phenolphthalein 0.1 % in alc. clear to red 9.3 -10.0 9.6
Effect of Ions in Water The pH value of a solution is set by the position of the equilibrium. Kw = [H+][OH- ] = K[H2O] = 1 x 10-14 Ions that remove H+ or OH- will lower or raise the solution pH. i.e. Adding NaAc (sodium acetate) consumes H+ by forming HAc. The Na+ ion does not consume OH- by forming a complex. The pH rises ( > 7).
H+ OH- M+ X- Predicting the pH change upon the addition of MX. Major interaction Minor interaction Net consumption/removal of H+ pH rises H+ OH- M+ X- Net consumption/removal of OH- pH falls
Solution Equilibria Reactions controlled by equilibrium occur in solution. i.e. the precipitation of salts AgCl Ag+ + Cl- Other major reactions are called COMPLEX FORMATION These are homogeneous reactions (all in one phase). Consider the case where ammonia (NH3) is added to Ag+ ions in solution. Ag(NH3)2+ Ag+ + 2NH3
Complex equilibrium constants are constructed in the same way as other equilibria. Ag(NH3)2+ Ag+ + 2NH3 Kinstab = [Ag+][NH3]2/[Ag(NH3)2+] Kstab = 1/Kinstab Most metal form complexes with negative ions in solution. These may result in a soluble or insoluble product. Ag(S2O3)2-3 Ag+ + 2S2O32- (thiosulphate) Ag(CN)2- Ag+ + 2CN- (cyanide)
The absolute values of Ksp and Kinstab are difficult to determine the relative values are not. Consider the salts Ag NO2, AgF, AgCl, AgBr, AgI, AgX (s) Ag+ + X- Q = [Ag+][X-] A solution of AgNO3 (soluble) Ag+ (0.1 M) mixed with a small volume of 1 M NaX, if: Q > KspAgX ppt Q < KspAgX no ppt
1 mL of 0.1 M AgNO3 1 drop of 1 M NaX NO2- F- Cl- Br- I- Since Q = [Ag+][X-] an observation of: No ppt ppt ppt ppt ppt Means the inference KspAgNO2 > KspAgX
1 mL of 0.01 M AgNO3 1 drop of 1 M NaX NO2- F- Cl- Br- I- An observation of: No ppt No ppt ppt ppt ppt Means the inference KspAgNO2 > KspAgF > KspAgX
Lowering the [Ag+] further can be achieved using complex formation. Ag(NH3)2+ Ag+ + 2NH3 4.0 M ammonia leaves low concentration of ‘free’ [Ag+] 16 M leaves even less. This logic can be used to test the relative strengths of complexes.