Download
1 / 19
190 likes | 270 Views
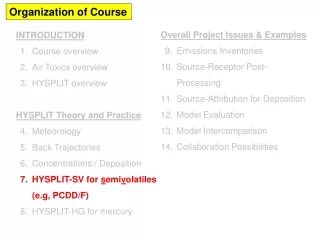
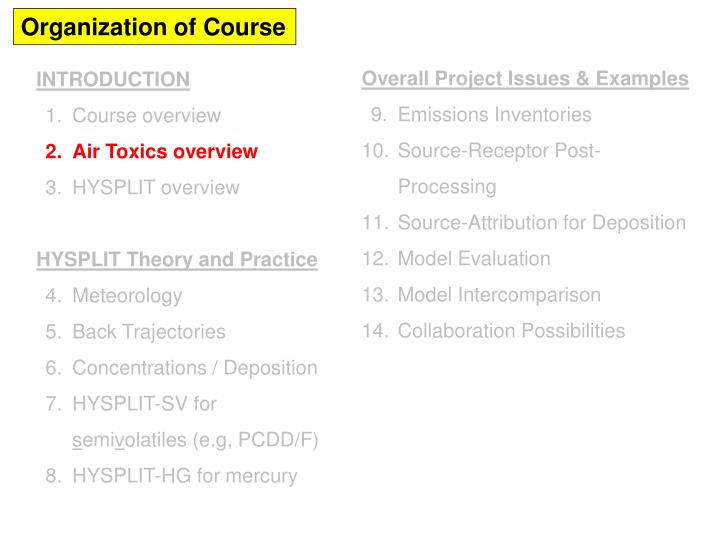
Organization of Course. Overall Project Issues & Examples Emissions Inventories Source-Receptor Post-Processing Source-Attribution for Deposition Model Evaluation Model Intercomparison Collaboration Possibilities. INTRODUCTION Course overview Air Toxics overview HYSPLIT overview

E N D
Organization of Course Overall Project Issues & Examples Emissions Inventories Source-Receptor Post-Processing Source-Attribution for Deposition Model Evaluation Model Intercomparison Collaboration Possibilities INTRODUCTION Course overview Air Toxics overview HYSPLIT overview HYSPLIT Theory and Practice Meteorology Back Trajectories Concentrations / Deposition HYSPLIT-SV for semivolatiles (e.g, PCDD/F) HYSPLIT-HG for mercury
For the atmospheric fate of air toxics, everything depends on vapor-particle partitioning • Wet and Dry Deposition • Atmospheric Chemistry vapor-phase pollutant example: Hexachloro-benzene (HCB) semi-volatile pollutant example: 2,3,7,8-TCDD low volatility pollutant example: OCDD particle-phase pollutant example: Cadmium
For the atmospheric fate of air toxics, everything depends on vapor-particle partitioning • Wet and Dry Deposition • Atmospheric Chemistry If the local atmospheric relative humidity is above 70-80%, particles become droplets and this affects partitioning, chemistry, and deposition vapor-phase pollutant example: Hexachloro-benzene (HCB) semi-volatile pollutant example: 2,3,7,8-TCDD low volatility pollutant example: OCDD particle-phase pollutant example: Cadmium
Approximate Atmospheric Half-Life (Days), based on: • vapor/particle partitioning • vapor-phase rxn with hydroxyl radical (OH) • dry and wet deposition of particle-phase and vapor phase fractions
Typical atmospheric “travel distance” is ~400 km/day, but this can vary a lot depending on the meteorological conditions
Consideration of the Exposure Pathway is Very Important • Inhalation? • Dermal (skin)? • Water? • Food? (and if so, which foods? This governs what you want to try to find out, (by modeling, by measurements, or by both)
atmospheric deposition to the watershed atmospheric deposition to the water surface Humans and wildlife affected primarily by eating fish containing mercury Best documented impacts are on the developing fetus: impaired motor and cognitive skills Mercury transformed by bacteria into methylmercury in sediments, soils & water, then bioaccumulates in fish adapted from slides prepared by USEPA and NOAA
Atmospheric Models and Atmospheric Measurements
to get comprehensive source attribution information ...we don’t just want to know how much is depositing at any given location, we also want to know where it came from: • different source regions (local, regional, national, global) • different jurisdictions (different states and provinces) • anthropogenic vs. natural emissions • different source types (power plants, waste incin., smelters…) Why do we need atmospheric models?
to get comprehensive source attribution information ...we don’t just want to know how much is depositing at any given location, we also want to know where it came from: • different source regions (local, regional, national, global) • different jurisdictions (different states and provinces) • anthropogenic vs. natural emissions • different source types (power plants, waste incin., smelters…) • to estimate deposition over large regions …because deposition fields are highly spatially variable, and one can’t measure everywhere all the time… Why do we need atmospheric models?
to get comprehensive source attribution information ...we don’t just want to know how much is depositing at any given location, we also want to know where it came from: • different source regions (local, regional, national, global) • different jurisdictions (different states and provinces) • anthropogenic vs. natural emissions • different source types (power plants, waste incin., smelters…) • to estimate deposition over large regions …because deposition fields are highly spatially variable, and one can’t measure everywhere all the time… • to estimate dry deposition ... presently, dry deposition can only be estimated via models Why do we need atmospheric models?
to get comprehensive source attribution information ...we don’t just want to know how much is depositing at any given location, we also want to know where it came from: • different source regions (local, regional, national, global) • different jurisdictions (different states and provinces) • anthropogenic vs. natural emissions • different source types (power plants, waste incin., smelters…) • to estimate deposition over large regions …because deposition fields are highly spatially variable, and one can’t measure everywhere all the time… • to estimate dry deposition ... presently, dry deposition can only be estimated via models • to evaluate potential consequences of future emissions scenarios Why do we need atmospheric models?
Models are not perfect “…Everyone believes monitoring results except for the person making the measurements… and nobody believes modeling results except for the person doing the modeling…” How not perfect are they? Results are encouraging, but difficult to evaluate models due to lack of contemporaneous monitoring and emissions inventory data Models are a test of our knowledge… If they don’t work, fundamental things about our understanding of atmospheric mercury that are wrong or incomplete… More certain info at a few locations (monitoring) vs. less certain info region-wide (modeling)
Oct Nov Dec Jan Feb Mar Apr May Jun Jul Aug Sep Recent Reactive Gaseous Mercury concentrations at the Grand Bay NERR, MS Air Toxic Phenomena Can be Very Episodic Then down for ~2 months due to hurricanes …. …. 2007 2008
Environmental Mercury Cycling -- Natural vs. Anthropogenic • Mercury (Hg) is an element... there is the same amount of mercury on Earth today as there always has been • “natural” Hg cycle – Hg is transported throughout the environment, and chemical transformations interconvert different mercury species • This has always been going on, and there has always been Hg in fish • But, we make some Hg unexpectedly “bioavailable” • Most anthropogenic Hg is “released” as atmospheric emissions: • Hg in coal is released to the air when coal is burned • Hg in other fuels is released to the air when they are processed and burned • Hg in ores is released to the air during metallurgical processes • Hg in products is released to the air when burned or landfilled after being discarded (e.g., batteries, switches) • Average, current atmospheric Hg deposition is ~3x pre-industrial levels • Evidence suggests that newly deposited Hg is more bioavailable
Freemont Glacier, Wyoming source: USGS, Shuster et al., 2002 Natural vs. anthropogenic mercury? Studies show that anthropogenic activities have typically increased bioavailable Hg concentrations in ecosystems by a factor of 2 – 10