Download
1 / 55
550 likes | 565 Views
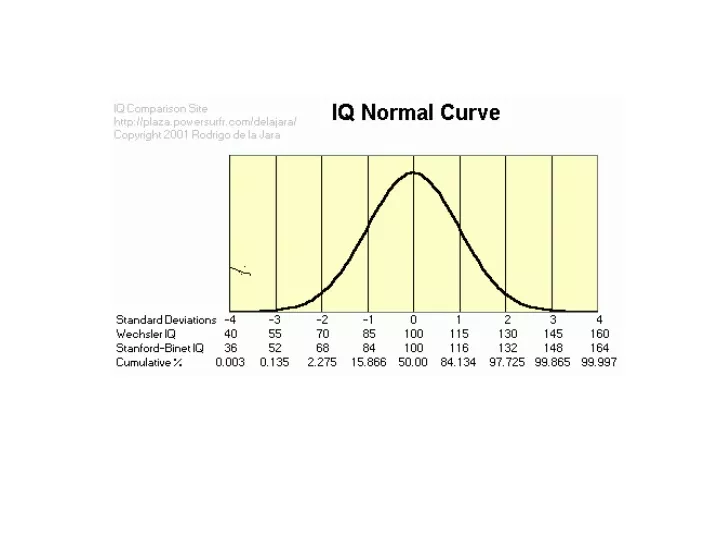
_ X = 100. Low. High. Distribution of IQ scores. How much of this variation is due to genotypic differences among individuals? What is the heritability ?. Maze learning in rats: selection for maze “bright” and “dull” strains of rats (R.C. Tryon 1942).

E N D
_ X = 100 Low High Distribution of IQ scores How much of this variation is due to genotypic differences among individuals? What is the heritability ?
Maze learning in rats: selection for maze “bright” and “dull” strains of rats (R.C. Tryon 1942) • Used a 17 unit (multiple “T”) maze • 2. Counted up the number of errors made • across multiple trials in the maze (19 trials) • Errors were counted as number of entries in • a blind alley • Rats making the fewest errors were mated • among themselves; rats making the most • errors were mated among themselves
Generation 0 Generation 4 MB MD Generation 8 MB MD 10 54 190 Number of errors in maze test
The response to directional selection for maze learning indicates that the heritability of maze learning is above zero What is the mode of inheritance of individual differences in maze learning?
MB MD 10 54 190 F1 rats 10 54 190 F2 rats 10 54 190
Maze learning appears to exhibit typical complex or polygenic inheritance
Are the maze “bright” and maze “dull” rats good and bad, respectively, at other tasks? In other words is their “intelligence” general or specific? In three out of five different measures of learning ability, rats of the “dull” strain performed at levels equal to or Superior to rats from the “bright” strain.
Mental retardation _ X = 100 Low High Distribution of IQ scores
MENTAL RETARDATION • DSM4 (Diagnostic and Statistical Manual for Psychiatric • Disorders, American Psychiatric Association) • Score of 70 or below on a standard IQ (intelligence • quotient) test • Adaptive functioning: how well the individual meets • age and culture specific standards • 3. Age of onset before 18 Degrees of severity: Mild: 55-70 Moderate: 35-55 Severe: 20-35 Profound: below 20
Genetic abnormalities and mental retardation • SINGLE GENE DISORDERS: • Phenylketonuria (PKU) used to be the leading single cause of mental retardation • X-linked (GDI1, PAK3,Oligophrenin, FMR2) • Angelman syndrome • Fragile-X syndrome • Duchenne muscular dystrophy • Picks disease • Galactosemia • CHROMOSOMAL DISORDERS • Downs syndrome: trisomy 21 • Turner syndrome: XO • Klinefelter syndrome: XXY, XXXY • Triplo X syndrome: XXX
Genetic abnormalities and mental retardation • SINGLE GENE DISORDERS: • Phenylketonuria (PKU) used to be the leading single cause of mental retardation • X-linked (GDI1, PAK3,Oligophrenin, FMR2) • Angelman syndrome • Fragile-X syndrome • Duchenne muscular dystrophy • Picks disease • Galactosemia • CHROMOSOMAL DISORDERS • Downs syndrome: trisomy 21 • Turner syndrome: XO • Klinefelter syndrome: XXY, XXXY • Triplo X syndrome: XXX
Evidence that genetics influences intelligence in man • Genetic abnormalities: single gene and chromosomal • aberrations are associated with impairments in • intelligence • Normal variation in intelligence: • Similarities between relatives ?
Demonstrating a genetic component to behavior • Family studies: Examine similarities between • family members. The closer the genetic relationship, • the more similar family members are predicted to be • Adoption Studies: Compares biological with adopted • family members. Biologically related individuals are • predicted to be more similar than adopted relatives. • Twin studies: Identical twins compared to fraternal twins. • Identical twins predicted to be more similar
Conclusion: Despite variability among studies, biological relatives are more similar than adoptive ones.
HUMAN EVOLUTION FOSSILS GENETICS
Phrenology is the study of the structure of the skull to determine a person's character and mental capacity. The Viennese physician Franz-Joseph Gall (1758-1828)was an early phrenologist. Bumps and indentations on the skull, according to Gall, reflect specific areas of the brain that determine a person's emotional and intellectual functions. It remained popular, especially in the United States, throughout the 19th century and was highly praised by Ralph Waldo Emerson, Horace Mann, Thomas Edison, and Alfred Russell Wallace.
Where do we come from? Human origins Relationships to other animal groups Relationships to other primates Early humans and their ancestors: Fossil history Temporal and spatial aspects of human ancestors
Domain: Eukarya Kingdom: Animalia Phylum: Chordata Class: Mammalia Order: Primates Family: Hominidae Genus: Homo Species: sapiens
Australopithecus afarensis Ethiopia 4-2.9 mya No stone tools Small cranial capacity
Australopithecus africanus 3-2.3 mya South Africa No stone tools
Australopithecus robustus 2-1 mya Southern Africa No stone tools
Australopithecus boisei East Africa 2-1mya No stone tools
Homo habilis 2-1mya East Africa Stone tools
Homo rudolfensis 2-1mya East Africa Stone tools
Homo erectus Widespread Africa, Asia
Homo neandertalensis Neander Valley-Germany: various interpretations such as a race before humans, a pathological specimen of man Now known to be a specialized hominid restricted to Western Europe and Mediterranean, living in rock shelters and caves.
Chimpanzee Teeth Brow Cranial size Sagittal crest Gorilla
Proposed history for the development of human language 6-7 million years ago Proto-hominids Simple hand gestures. Vocalizations of alarm, emotions, etc. 4-5 million years ago Australopithecine hominids. Advent of bipedalism: appearance of more sophisticated hand signalling 1-2 million years ago Homo habilis and Homo erectus Hand gestures become fully syntactical, vocalizations start to become symbolical, stark increase in brain size 100,000 years ago Homo sapiens uses vocal language, zenith of brain development, hand gestures play secondary role