Download
1 / 21
210 likes | 317 Views
Project 3.1 Universal Communications Infrastructure Prof Dave Michelson, UBC Students: Sina Mashayekhi , Bruce Haines and the UBC Radio Science Lab team. Background and Motivation.

E N D
Project 3.1 Universal Communications Infrastructure Prof Dave Michelson, UBC Students: SinaMashayekhi, Bruce Haines and the UBC Radio Science Lab team
Background and Motivation • Electrical power utilities monitor, protect and control generation, transmission and substation assets using sophisticated SONET-based networks. • Smart Grids seek to extend such capabilities to both distribution assets and customer premises. • The scale of the problem requires new and cost-effective approaches to providing connectivity via wireless, fibre optic or power line carrier systems.
The Designer’s Dilemma • Most of the candidate technologies for providing Smart Grid network connectivity did not exist a decade ago. • Moreover, most were designed for deployment scenarios different from those encountered in Smart Grids. • The Smart Grid designer’s dilemma: • Overdesign leads to unnecessary expense! • But under design is even more costly! • Regulations may not reflect reality! • Standards are set by designers, not users!
Project 3.1 - Objectives • Project 3.1 seeks to provide telecom architects, regulators, designers and manufacturers with a solid basis for making good design/business decisions regarding Smart Grid connectivity. • Our propagation and interference models will be based upon extensive field data collection & will capture our knowledge and intuition regarding alternative deployment scenarios in a form useful in design and simulation.
Project Trainees • Dr. Nikola Stanchev, Research Associate • SinaMashayekhi, PhD Candidate • BoubacarDiallo, MASc • Sol Lancashire, MASc candidate (part-time) • Alex Corbett, MASccandidate (part-time) • Bruce Haines, MASc candidate • Nina Chen, MASc candidate • Andy Tsai, BASc • AhadShafiq, BASc • Edgar Cave, Senior Undergraduate • Lawrence Penkar, Senior Undergraduate
Industry Advisory Panel An expert team provides us with insights and advice! • Kip Morison, CTO, BC Hydro • Keith Martin, CTO, Tantalus Systems • Lee Vishloff, President, Nebula Manufacturing • Sam Shi, CTO, Corinex Communications • Ibrahim Gedeon, CTO, TELUS • DraganNerandzic, CTO, Ericsson • Wen Tong, CTO, Huawei Technologies • YannLeHelloco, CTO, Mentum • Yves Lostanlen, CTO, Siradel • Philippe Guillemette, CTO, Sierra Wireless
Avoiding Risk! Propagation and interference models help business manage risk and avoid unpleasant surprises. • Will the wireless link be reliable? • Will the link meet expectation and drive revenue? • Will the link be over engineered or barely adequate? • Will the link work as well in the field as it did on paper?
Conceptual Design System Engineering Implementation System Integration Manufacturing System Deployment & Operation Software SimulationTools Hardware Simulators RF Planning Tools Propagation and Interference Models
Propagation Channels and Impairments • The nature of propagation channels and their impairments depends upon: • The distance between transmitter and receiver • The nature and distribution of intervening obstacles • The nature and distribution of surrounding scatterers • The radiation patterns and heights of the transmitting and receiving antennas
Our Strategy Work with our industry partners to: • Identify key physical differences between conventional and Smart Grid scenarios. • Identify impairments that are likely to impact Smart Grid performance. • Devise experiments that will reveal the nature of such impairments. • Collect measurement data and then reduce into models useful in design and simulation.
Our Strategy Divide deployment scenarios into three categories, develop models for selected propagation impairments and interference • Household • ranges from 1-20 m; picocellconfigurations • Neighbourhood • ranges from 20-1000 m; microcell configurations • Wide Area • ranges from 500 m – 20 km; macrocell configurations
Propagation Van 2002 Chevy Astro van • 8 ft x 5 ft cargo area • 25 U equipment rack • 2 kW electrical system • 2 kW inverter • 2 kW generator • 440 Ah batteries • Cable passthroughs • Laptop mount and backup display. • Few other research labs in Canada have this capability.
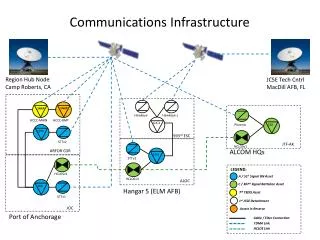
Multicarrier Channel Sounder Multicarrier Signal Propagation Van Base Station GPS Rcvr Rb Freq Std PA Laptop Vector SignalAnalyzer Vector SignalGenerator Laptop GPS Rcvr Rb Freq Std
Fading on Multiple Carrier Signals Transmitted Signal • Channel impairments cause the multiple carriers (including pilot tones) to fade in characteristic ways
Carrier Frequency and Doppler Rate • We have found a linear relationship between depth of fading (Ricean K-factor) and carrier frequency over the range 200 MHz – 2 GHz. • On mobility NLOS links, Doppler rate is proportional to carrier frequency. • However, on fixed NLOS links, we found little variation in Doppler rate with carrier frequency – unsuspected until now! • Our work has thus revealed a fundamental difference between mobility and fixed NLOS links.
Shadow Fading and Terminal Height • In Smart Grid scenarios, terminals are often located at poletop height – 6-7 m; Compare to 1-2 m for conventional models.. • Previous work has found that path gain increases with terminal height. • Our studies have found that shadow fading increases by 3-4 dB as terminal height increases from pedestrian height to mean building height then decreases as the terminal height increases further – unsuspected until now! • .
Other Accomplishments • MITACS Accelerate Grant - Study on the Frequency Response of Overhead Transmission Lines (Nina Chen, MASc candidate with Dr. James Toth, BC Hydro) • In-Kind Contribution from Communications Research Centre: Porting CRC’s Spectrum Explorer to our Agilent N6841A RF Sensors for use in Spectrum Occupancy Studies • Collaboration with Mentum: Updating Mentum Planet for Planning Smart Grid Wireless Networks
Next Steps • Angle of Arrival Distribution Studies • Interference Studies • Spectrum Occupancy Studies. • Comparison of Alternative Channel Reuse Schemes for WiMAX Networks • Influencing Industry Canada Requirements for Directional Antennas at WiMAX Terminals. • Influencing Industry Canada Policy for ISM Band Applications • Power Line Channel Models
An Invitation • If you have a Smart Grid airlink issue that you would like help to resolve, please contact us! Prof. Dave Michelson davem@ece.ubc.ca