Download
1 / 18
180 likes | 324 Views
Fire Plan Framework. Fixing What Didn’t Work 1996 : Intensive analysis to prioritize project areas ignored opportunity factors data limitations impacted results, required Unit wide validation staff without GIS skills “locked out” weighting assets created winners and losers

E N D
Fire Plan Framework Fixing What Didn’t Work 1996: Intensive analysis to prioritize project areas ignored opportunity factors data limitations impacted results, required Unit wide validation staff without GIS skills “locked out” weighting assets created winners and losers 2010: Units select projects document risk and opportunity factors validate data only as needed for projects
Fire Plan Framework Fixing What Didn’t Work 1996: Unique Framework for CAL FIRE on our own in terms of developing data and tools limited collaborative possibilities 2010: Linked to national efforts assets derived from RAVAR effort (part of WFDSS) priority landscapes as performance measures, from USFS Service national framework for state forest assessments.
Fire Plan Framework Fixing What Didn’t Work 1996: Pre-fire data captured by Units had no broader utility within the organization value-added potential of data capture for other programs lost 2010: Centralized data capture (Cal MAPPER) pre-fire data available for emergency incident support and other uses
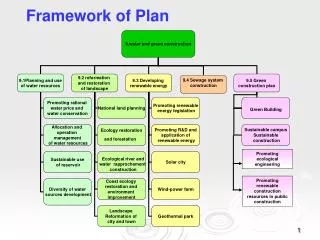
Fire Plan Framework Three Components Define projects: The Fire Plan template provides a mechanism for Units to identify where pre-fire projects are most needed to mitigate risk. Document project selection: This involves a “checklist” approach to document the decision making process used to define projects. Analyze project effectiveness: Performance measures are needed for evaluating the effectiveness of a project. Initially, this can just be the total quantity of Values at Risk and priority landscapes (from the FRAP Assessment) that potentially face reduced risk as a result of the project. Over time we will pursue more rigorous analyses using fire behavior and fire response modeling.
Fire Plan Framework Define the Project Unit PFEs, working with Battalion Chiefs, other Unit staff, and local cooperators identify and design appropriate projects to mitigate risk. A variety of GIS datasets are available within Cal MAPPER to assist in this effort. Important concepts related to projects are; Activity: an activity is the most basic unit of pre-fire workload. An activity is a task performed in one specific area within a defined time period, in order to reduce risk. Treatment: consists of one or more activities that modify current conditions in order to reduce risk. Thus, activities can be viewed as the individual tasks involved in conducting a treatment. The following example may help in understanding these two critical concepts; Treatment - Shaded fuel break Activity 1: mechanical thin performed during year 1 Activity 2: pile and burn conducted in year 2
Fire Plan Framework Treatment Area and Project Areas Treatment Area: Consists of one or more polygons to undergo treatment. A treatment area can have multiple activities that occur over time, for example for maintaining a fuel break. Project: Consists of one or more treatment areas, which can include prescribed fire, fuel breaks, inspections, education, ignition management, etc. A project can include treatment areas with activities performed by different cooperators. Project Area: This is the area that encompasses all treatments for a project. Often the project area will be a defined area such as a community, a state park, or a large parcel. At a minimum, the project area must include the sum of all treatment areas, or could include a buffer area around the treatments.
Document Project Selection The new framework employs a checklist approach in order to document the decision making process used to define projects. An important concept for this approach is; Checklist Area: The area that includes the combination of risk factors to be mitigated by a project. The checklist approach involves creating qualitative or coarse quantitative estimates for risk and opportunity factors, shown below. Risk Factor Summary: summarize risk factors in terms of overall likelihood, nature of, and consequences of “worst case” fire events. Risk Factors include: Fire Weather, Fuel Hazard, Ignition History, Fire History, Past projects, Assets, Response Capability Opportunity Factor Summary: summarize opportunity factors in terms of ability to implement a project, and constraints that impact project design. Opportunity Factors include: Natural fire barriers, Project Funding Availability, Partners and stakeholders, Landowners, Environmental compliance
A sample checklist area is shown below, which is composed of a watershed boundary truncated by a state highway on the west. The Unit wants to implement a project to protect the community of Flammaville. The checklist area is large enough to show the nature of the risk faced by the community.
Document Project Selection Completing the Checklist • Tell a (true) story • Include “worst case” fire events • Validate GIS data within the checklist area as needed to tell the story • Utilize Data Summary Tool to create summary statistics (total structures, ignitions by cause, acres burned by year, etc.)
Assets such as Structures are examples of a risk factorRAVAR Structures Data
Checklist Data in the Data Summary tool; The checklist datasets included within Cal MAPPER are shown below: Communities, Fire History, Ignitions, Incorporated cites, Ownership, SRA, Terrain, Times Burned and Vegetation Types.
Analyze Project Effectiveness Analyze Project Effectiveness The Fire Plan framework uses Values at Risk (VAR) and Priority Landscapes (PLs) from the 2010 FRAP Assessment as performance measures to analyze project effectiveness. There are three ways to quantify VARs; • Total amount of a VAR potentially at risk (e.g. number of houses, MBF of timber) • Total dollar value of a VAR potentially at risk (e.g. housing value, timber value) • Expected damages (e.g. net timber value lost after salvage) To perform an economic analysis of project effectiveness, expected damages are needed in order to compare damages with and without a project. The current Fire Plan VAR data includes examples where we have been able to quantify expected damages from fire (e.g. the range VAR), but most other VARs can only be expressed as total amount potentially at risk.
Analyze Project Effectiveness Performance measures used to analyze project effectiveness will be the total quantity of the various assets and PLs that will potentially have reduced risk as a result of the project. Terms • Treatment Influence Zone (TIZ): the area where the treatment mitigates risk factors such as fire probability, fire behavior, asset exposure, ignitions, etc. • Project Influence Zone (PIZ): the sum of all TIZs for all treatments associated with a project. The PIZ defines the area where the entire project influences risk factors.
Analyze Project Effectiveness Define Treatment Influence Zone (TIZ) Professional judgment, or fire behavior modeling
Analyze Project Effectiveness Performance Measures • Data Summary Tool used to summarize total assets and priority landscapes at risk within the TIZ • Performance measures for a project are the sum across all TIZs • Eventually, with improved science we can quantify expected losses rather than total assets at risk
Analyze Project Effectiveness The following data components will be uploaded to the CAL MAPPER; • Project area (GDB) • PIZ (GDB) • Treatment area Polygon(s) for each treatment (GDB) • Tabular data on Activities, funding, stakeholders, etc • Support Polygons, Lines and Points • TIZ for each treatment, if the TIZ is not identical to the treatment area (GDB)