Download
1 / 33
330 likes | 411 Views
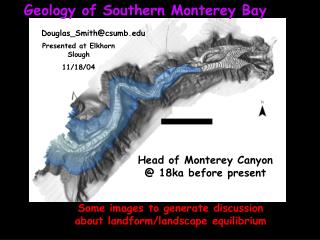
Climate Change, Hazard Assessment and Adaptation in Southern Monterey Bay. Photo by Brad Damitz, MBNMS. Littoral Cell. Summary of RSM Approaches. Stable. Reduce or eliminate mining of sand from beach. Continued dune erosion. Beach nourishment.

E N D
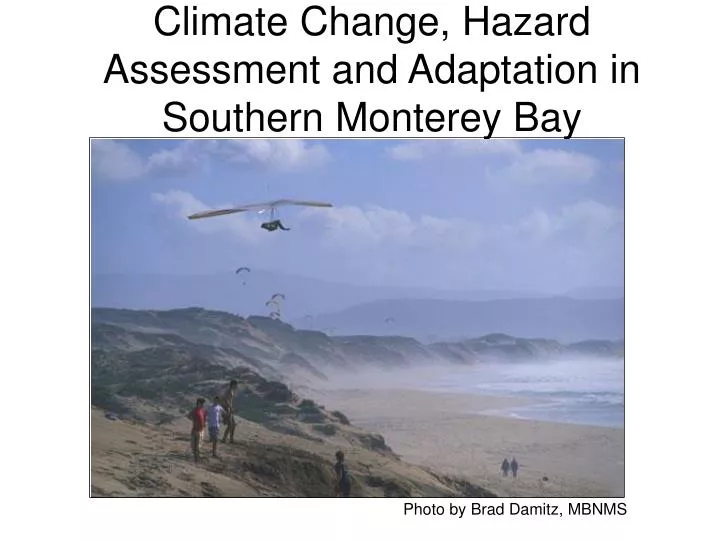
Climate Change, Hazard Assessment and Adaptation in Southern Monterey Bay Photo by Brad Damitz, MBNMS
Summary of RSM Approaches Stable Reduce or eliminate mining of sand from beach Continued dune erosion Beach nourishment
A Scenario Based Approach to assessing the Impacts of Sea Level Rise to the California Coast Dr. David Revell and Bob Battalio, P.E. Matt Heberger, P.E., Dr. Peter Gleick, Heather Cooley, Justin Vandever and Brian Spear California Coastal Records Project Photo by D. Revell – 2/23/08
Societal Relevance Scientific Confidence Uncertainty and Decision making Space Time
Download Climate Action Team CA Energy Commission PWA (www.pwa-ltd.com) • Questions • d.revell@pwa-ltd.com
General Approach - Vulnerability Adopt CA climate scenarios (1.4 and 1.0 m by 2100). Expand 1990 Pacific Institute Study of SF Bay to outer coast Develop maps of flood and erosion hazards for CA coast. Identify populations and infrastructure at risk. Offer policy guidance and recommendations.
Hazard Maps “Not for planning purposes”
Risk - Mapping Flood Hazards New 100-yr Flood Elevation with Sea Level Rise 100-yr Flood Elevation Wave height 100-yr Still-Water Elevation • Review all existing FEMA Flood Insurance Studies • Extract Coastal Base Flood Elevations into GIS • Add Sea level rise scenarios to BFE elevations • Map inundation using terrain datasets
Risk - Mapping Erosion Hazards Cliff Dune
Dune Erosion Model 3 components – Changes in TWL from SLR combined with shoreface slope Historic shoreline trends (USGS) Impact of a “100 year storm event”
Dune Hazard Zones Offshore Baseline Qs 1998 Toe Air Photo from 2005
Cliff Erosion Model Acceleration of historic erosion rates (Rh) Prorated based on % increase in TWL exceeding the elevation of the toe of the beach/cliff junction Include geologic unit standard deviation x planning horizon to account for alongshore variability
Cliff Hazard Zones Offshore Baseline Qm 1998 Cliff Edge Air Photo from 2005
Results - Dunes Revell et al in prep • Majority of Norcal “accreting” • Accreting to Erosion reversal in sign seen between 2050 and 2100 • 300 km or 185 miles
Results - Cliffs • Geology exerts strong influence • Wave exposure and toe elevation important • 1,140 km or 710 miles Revell et al in prep California Coastal Records Project
Property at Flood Risk by Sector Pacific Coast
Infrastructure at Risk At Risk by 1.4m SLR • Roads: 3,500 miles • Highways: 400 miles • Railroads: 300 miles* • Schools: 139 • Hospitals: 55 • Police/Fire Stations: 34 • Power Plants: 30 • Wastewater Plants: 28
Study Products • Methodology for evaluating coastal erosion and SLR for different backshore types • Down-scalable model for evaluating local impacts of climate change • GIS erosion hazard zones of two scenarios at 3 planning horizons • Flood elevations for the CA coast • Estimates of future erosion rates • Erosion rates by geologic unit Photo by D. Revell – 2/23/08 Photo by P. Barnard
Potential Impacts to Monterey County 4.4 square miles of eroded lands Dunes – Average ~600ft ; Maximum ~1250ft Cliffs – Average ~120ft Maximum – 720ft Vulnerable Population Flood – 14,000 people Erosion – 820 people Infrastructure Highway – 42 miles Roads – 125 miles Railways – 25 miles Photo by B. Damitz
Societal Relevance Scientific Confidence Uncertainty and Decision making Space Time
Is climate change happening? Yes No Food and water shortages, global conflicts. Huge $$$ to respond to emergency No No new problems Should we take action? Yes Spend $$$ to upgrade infrastructure and improve resiliency Improve sustainability, self sufficiency, avert disaster
Adaptation Choices Hold the line Retreat Change use More people and property threatened Risk Acceptable Risk Time or Sea Level Elevation
Categories of Alternatives Land Use Planning Non-structural Structural Time Horizons – Immediate 0-5 years Short 5-25 years Medium 25-50 years Long 50-100+
Evaluation Criteria Effectiveness – reduce threat to structures Effectiveness – maintain beach width Costs – project cost vs no action* Environmental – impacts +/- to ecosystem Recreation – impacts +/- to rec. opportunities. Safety/Access – impacts +/- lateral access Aesthetics – judgment* Regulatory viability – fed, state, local regs. Resiliency – adaptability to future conditions Cumulative –if all oceanfront parcels treated Certainty of success –scientific certainty
Land Use Planning Tools Rolling Easements Managed Retreat Transfer of development credit Conservation Easements Present use tax Fee Simple Acquisition Structural or Habitat Adaptation Setbacks for Bluff top Development Setbacks + Elevation for Beach Level Development Generally issues are: high upfront costs, long implementation timelines, limited application, or put off the problem until a later date
Non Structural Sand Mining cessation SCOUP/ Opportunistic Sand Beach Dewatering Active Pumping Passive – PEMs Desalination wells Beach Nourishment General approach is: increase natural sand supply, accelerate natural accretion processes, or augment sand volumes
Structural Tools Revetments Seawalls Perched Beaches Groins Breakwaters Artificial Reefs/ Submergent Breakwaters/ Low Crested Structures Photo courtesy G.Griggs $5.3 million sand mitigation fee for lost recreational beach over the life of the seawall