Download
1 / 37
370 likes | 438 Views
A CONTRIBUTION OF BMSW TO SOLAR WIND PHYSICS: OVERVIEW OF RESULTS. Z. Nemecek , J. Safrankova , L. Prech , O. Goncharov , P. Cagas , A. Pitna , A. Komarek , K. Jelinek , F. Nemec University , Faculty of Mathematics and Physics, Prague, Czech Republic

E N D
A CONTRIBUTION OF BMSW TO SOLAR WIND PHYSICS: OVERVIEW OF RESULTS Z. Nemecek, J. Safrankova, L. Prech, O. Goncharov, P. Cagas, A. Pitna, A. Komarek, K. Jelinek, F. Nemec University, Faculty of Mathematics and Physics, Prague, Czech Republic G. Zastenker, I. Koloskova, M. Riazantseva IKI RAN, Moscow, Russia The authors would like to acknowledge the effort of numerous collaborators that participate in the BMSW development and calibration, namely: J. Vaverka – FC modeling, I. Cermak – hardware development, L. Chesalin – telemetry interface, N. Shevyrev – FC modeling, A. Leibov – device calibration Moscow, February 10 – 14, 2014
Bright Monitor of the Solar Wind (BMSW) 4 • Launch July 18, 2011 • Apogee ~50 RE • Inclination 65o • Orbital period ~8.5 days • Time resolution 31 ms • Three axis stabilized Developed by Charles University in Prague and Space Research Institute in Moscow for Spektr-R 5 3 2 1 0 • Three Faraday cups for determination of the speed and temperature - 0, 1, 2 • Three declined Faraday cups for determination of the density and velocity direction – 3, 4, 5 Safrankova et al. (SSR, 2013) Zastenker et al., (Cos. Res. 2013)
Overview of new results The contribution deals with: Helium abundance and its variations Shock front, its structure, and thickness Solar wind turbulence 1 3 2
BMSW in the sweeping mode Protons Alphas • BMSW in the sweeping mode; speed of measurements – 0.031 s • a full set of solar wind parameters – 1-3 s • details of distributions – protons and alphas
Mean He abundance V T N He abundance • A low proton density implies low relative He content (about 2%) regardless of speed or temperature. • A rise of mean He content with the speed is already known. • An increase of the He abundance with the proton temperature was not mentioned. • A very low He abundance at dense solar wind (> 20 cm-3) often observed. 3 1 4 2
Two classes of abrupt changes of helium abundance Although the He content varies from 2 to 12%, the changes do not correlate with any other solar wind parameter Distribution of derivatives of the He relative content shows that large changes are frequently observed • Which of these two cases is more frequent? • What is the physical reason for such behaviour? • Has this observation a broader consequences? In other cases, a clear correlation of helium content with density and/or velocity can be found
Correlation of abrupt changes of helium abundance dT dV dN He variations 30 s averages Full (3 s) resolution He variations Safrankova et al. (ApJ, 2013) • No correlation of He abundance variations with variations of other parameters • The variations are due to turbulence driven by alpha/proton differential flow • This turbulence heats the wind – positive correlation of AHe and temperature
Another view on He abundance variations He density He density Proton density Proton density • Short intervals with different alpha and proton behavior • These variations are probably caused by crossings of the boundaries between solar wind streams of different origin • The reasons for (anti)correlations should be investgated Zastenker et al., (Cos. Res. 2013)
Temporary conclusion – He abundance In spite of still small amount of the data, we have found: • Abrupt changes of the relative He abundance without changes of the speed or other plasma parameters are frequent • Two sources of He content changes – (1) solar wind structure and (2) turbulence driven by differential flow • Already reported rise of the He abundance with the speed is observed only in a sufficiently dense solar wind (compare with Kasper et al., 2007) • The He abundance depends on the proton temperature or, more probable, the He abundance controls the proton temperature
Expectation on solar wind turbulence ωc General view -1 • Power law frequency spectrum with several segments • -1 slope on large scale determined by the solar activity • -5/3 (Kolgomorov) slope at the MHD scale (MHD waves) • -7/3 slope at the ion kinetic scale (KAW, ion cyclotron waves) • A steeper slope at the electron scale -5/3 -7/3 Power spectral density -? MHD kinetic Years to days ion electron Present knowledge • The spectral slope at the upper end of the MHD range is often lower • The plateau would be more distinct for low beta and for low level of density fluctuations (Chandran et al., 2009)
A novel description of the spectra • An example of precise processing of density fluctuations for statistics • This example is taken from June 2, 2012, 01-06 UT (5 hours) • FFT is computed on ~20-min time interval with shift of ~2 minutes Three different spectral slopes are clearly revealed The plateau location shifts in the frequency domain Ion inertial length plateau -5/3
Mean spectral slope • Solar wind intervals without abrupt transients (IP shocks etc.) • FFT is computed on ~20-min time intervals with shift of ~2 minutes • Mean values of the slopes as a function of the frequency in spacecraft frame are shown • Gyrostructure frequency computed as proton thermal gyroradius divided by sw speed • The mean slope in MHD range is ~ -1.95 • The mean slope in kinetic range is ~ -2.5 • The increase of the mean slope between 0.005 and 0.5 Hz is caused by a flattening of the spectra • The following decrease is caused by variations of the breakpoint 2 frequency • The frequency of the breakpoint 2 seems to depend on the gyrostructure frequency
Slope in MHD range • Solar wind intervals without abrupt transients (IP shocks etc.) • FFT is computed on ~20-min time intervals with shift of ~2 minutes • Mean values of the slope is probably a function of the proton density fluctuations (standard deviation) • The only plot with a reasonable organization • The mean slope in MHD range decreases with the proton density fluctuations • The dependence is weak but out of the error bars • Does it mean that larger fluctuations dissipate faster?
Slope in the kinetic range • Slope in the kinetic range does not depend on any of analyzed parameters significantly • Decrease of the slope with standard deviation of the proton density. This trend is opposite than that for MHD range • A slight hardening with increasing solar wind speed
Breakpoint 1 • Breakpoint 1 – between the MHD range and spectral flatenning • The frequency of the Breakpoint 1 decreases with the thermal gyroradius • The frequency of the Breakpoint 1 increases with the gyrostructure frequency • The correlation coefficients are low but the dependences seem to be real
Breakpoint 2 • Breakpoint 2 – between the MHD range (with spectral flatenning) and kinetic range • The frequency of the Breakpoint 2 decreases with the thermal gyroradius • The frequency of the Breakpoint 2 increases with the gyrostructure frequency • The correlation coefficients are relatively large
An example of extreme turbulence • A period of large fluctuations in the solar wind on March 17, 2012 (?distant foreshock?) – two intervals, A and B • A part of quiet wind exhibits “classical” spectral shape with a plateau • Nearly white noise observed at low frequencies (<0.01 Hz), the Kolgomorov range shifted toward higher frequencies • The plateau (maybe) still exists • Spectra from such intervals are not included in previous statistics BMSW -1.7 -0.8 Type A -2.6 -0.3 -1.7 Type B -4.6
Temporary conclusion - turbulence BMSW provides reliable moments of the ion distribution with 31 ms time resolution The description of the spectral shape with a “plateau” A mean slope of ~1.95 (i.e., much steeper than 5/3) was found for the MHD scale, a mean value of 2.5 at the kinetic scale is close to 7/3 The break frequency between MHD turbulence and plateau increases with gyrostructure frequency The same is true for the second break frequency Frequency spectra in the foreshock or other disturbed regions like ICMEs starts with the “source” slope – close to -1
Two extreme cases of IP shocks • The ramp width varies by an order of magnitude - search for scaling parameter(s) • Subcritical shocks - reflected ions cannot participate in a ramp formation • Wave trains observed often upstream and/or downstream • Shock ramp duration - 0.096 s • Shock speed – 524 km/s • Ramp thickness – 50.4 km • Ion inertial length – 16.6 km • MA=2.7; MMS=2.4; θBN=72o; β=0.2 • Shock ramp duration - 0.48 s • Shock speed – 704 km/s • Ramp thickness – 338 km • Ion inertial length – 99.6 km • MA=3.8; MMS=2.4; θBN=70o; β=1.3
Analysis of the distribution function Ion distributions measured just inside the shock front MA = 1.9 Thickness = 62 km Gyroradius = 20 km Theta BN = 82 deg Prior to shock ramp Inside the ramp After shock ramp • Plasma parameters are computed from 3 points of distribution – how reliable this method is at shocks? • The normalization of the FC current to the full ion flux enables determination of plasma parameters even in highly disturbed environment of the shock • The three-point method (adaptive mode of BMSW) is based on this normalization • The ion distribution measured inside the shock ramp reveals complete thermalization within 300 ms (one ion gyro-period)
Ramp scaling – proton inertial length • Ion inertial length was suggested as a scaling parameter by several authors (e.g., Papadopoulos et al., 1985; Matsukio and Scholer, 2006) • An impression of a slight positive correlation is based on one point from twelve • The proton inertial length is probably not a best possible scaling parameter for subcritical shocks • Gedalin et al. (1997) suggested that such shocks would scale with the convected proton gyroradius (reflected ions participate in the shock formation) corrected on the θBNangle • Our statistic shows that it is not true for sub-critical shocks, probably because no reflected ions are present
Ramp scaling – thermal gyroradius • Our statistics shows the downstream thermal proton gyroradius as a best scaling parameter • The fit reliability is 0.87 in spite of the fact that the propagated magnetic field (Wind) was used for its determination Nemecek et al. (GRL, 2013)
Upstream and downstream waves Non-phase standing precursor whistler waves and steepened magnetosonic waves with leading whistler – shocklets were observed upstream of quasi-perpendicular IP shocks (Wilson et al., 2009, 2010, 2012) Downstream –irregular ULF fluctuations and regular high-frequency waves were reported (e.g., Kajdic et al., 2012; Ramirez Velez et al., 2012) A comparison of Wind and Spektr-R wavelength suggests that downstream waves are not so irregular as expected (note that short Wind wavelengths can be due to aliasing A comparison of IP shock structure in magnetic field (Wind) and plasma (Spektr-R) suggests that both spacecraft observe the same waves
Upstream and downstream waves • A preliminary analysis shows that wavelength of downstream waves linearly increases with the ramp thickness • Since the ramp thickness is determined by the proton thermal gyroradius, both features are of a kinetic nature • The upstream waves do not exhibit such organization – what can be their source in the case of subcritical shocks?
Temporary conclusion - shocks • Conclusions are valid for subcritical quasi-perpendicular shocks • Gradients of ion parameters observed at the IP shock are as step as those of the magnetic field or electron temperature (Schwartz et al., 2012) • No clear correlation of the shock ramp thickness with the magnetic field, solar wind parameters and/or their combinations was found • The shock ion ramp thickness is controlled by the thermal proton gyroradius • What is the mechanism of the proton heating on such a small scale? • Our analysis shows that wavelength of downstream waves is directly proportional to the IPS ramp thickness • It suggests a kinetic origin of these features • The correlation of the upstream wavelength with the shock ramp is weaker
Directions of further investigations • Collection of a significantly larger data set • Statistical analysis of spectral slopes and investigation of dependences of slopes and break frequencies on other parameters • Search for the sources of enhanced fluctuations • Search for the cause of fast large variations of the He abundance • A further analysis of the IP shock (and bow shock) ramp and waves connected with it Thank you for your attention
How to reach the ion kinetic scale ? FC1 FC2 • Three identical FCs • Voltages on deceleration grids of FC1 and FC2 set by a feedback to obtain ~ 50% and 30% of the FC0 current • 3 points of the distribution are enough to calculate basic plasma moments • Maximum time resolution is given by telemetry bit rate FC current
Helium abundance in the solar wind • An average content of the alpha particles is ~3-4% with large variations ranging from 0.5 to 10%; even larger values were observed within ICMEs • He relative content varies with the solar cycle • He content is statistically larger within fast solar wind streams that originate from coronal holes. • Helium content rises with the solar wind speed but there is no direct correlation (correlation 0.94 for the slow solar wind only - Kasper et al., 2007) • Smaller attention was devoted to fast abundance variations connected probably with different regions of the solar wind origin in the Solar corona
Upstream or downstream gyroradius? • As the figure shows, upstream and downstream gyroradii are about the same because the increased magnetic field is compensated by a similar increase of the thermal speed • The plot of both upstream and downstream gyroradii provides the fit with a similar slope but the reliability of the fit is slightly worse.
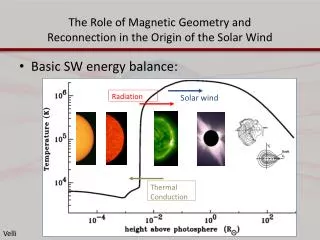
Solar wind turbulence Solar wind is heated by dissipation of turbulent structures but the nature of dissipation processes would depend on the scale Until present, only MHD scale was accessible for experimental investigation of plasma turbulence due to insufficient time resolution of sounding devices The experimental evidence was based on analysis of magnetic field measurements but the coupling between plasma and magnetic field is principally different at MHD and kinetic scales BMSW device provides the plasma moments with 31 ms time resolution – well inside the kinetic scale
Interplanetary and bow shock studies MOTIVATION ~2 min • INTERSHOCK • BIFRAM • Bow shock on May 12, 1985 • 0.6 s resolution • Plasma deceleration in front of the shock • Large amplitude oscillations downstream Do you remember this figure? Zastenker et al. (1986)
An example of measurements and their comparison with other spacecraft BMSW-Spektr-R 3DP-Wind ESA-THEMIS B 2.5 hours 25 minutes 60 seconds • All spacecraft measure similar features on a scale of hours • Notable differences on scale of minutes • BMSW shows a high level of fluctuations • at the kinetic scale 15 seconds
Instrumental noise • When the solar wind is extremely quiet the velocity spectra are spoiled by the preamplifier noise • This effect decreases the available frequency range Frequency spectrum of speed Noise spectrum determined onboard Frequency spectrum of preamplifier noise
Spectral analysis of FC currents FC0 FC1 FC2 Power spectra of FC currents allow us to determine which part of the distribution is responsible for a particular feature • It can be clearly seen that the hump on the density spectrum is caused by the low energy part of the distribution in this particular case • The presence of the hump increases the break frequency FC2 FC1 FC0
Spectral analysis of plasma moments 1.01 1.01 1.28 N V Vth 3.18 2.69 3.57 • Spectral slopes of density and velocity fluctuations are different • Spectral slopes in the MHD range are close to 5/3 but often lower • Spectral slopes in the kinetic range are always larger than 7/3 • The break frequency of density fluctuations is larger, whereas that of velocity (temperature) fluctuations is lower than ion cyclotron frequency 0.29 Hz 0.1 Hz 0.14 Hz
First statistics Kinetic scale Density Spectral break [Hz] Spectral slope (density) Velocity MHD scale Ion inertial length Ion inertial length • The break between scales is above the cyclotron frequency for density fluctuations but below it for the velocity • The break frequency decreases with the ion inertial length • The slope is about 5/3 in the MHD scale and about 3 in the kinetic scale • Both slopes decrease with the ion inertial length Spectral break [Hz] Ion cyclotron frequency Safrankova et al. (PRL, 2013)
A new emission? N V Vth ωc ωc ωc • The spectra of moments often exhibit a plateau or a peak at a fraction of ion cyclotron frequency • This peak/plateau is more often seen at density spectra • A similar plateau can be found in the Wind magnetic field magnitude B