Download

1 / 16
160 likes | 290 Views
Using real world data in math. Sara Turnbull Andy Albee. A little story. August 1, 2007 – Twins Vs. Kansas City Royals I picked up my wife Laura at 5:20 35W is packed due to construction on the bridge. HW 65 over the river and 2 nd St. to Dinkytown Eat at the Quarry

E N D
Using real world data in math Sara Turnbull Andy Albee
A little story • August 1, 2007 – Twins Vs. Kansas City Royals • I picked up my wife Laura at 5:20 • 35W is packed due to construction on the bridge. • HW 65 over the river and 2nd St. to Dinkytown • Eat at the Quarry • 35W still packed at 6:20 pm • Back to the game via HW65
Today we will build and test bridges • Wewill set up with materials and instructions • Each group will make two bridges and test them (three if we have time). • In a regular class, we would do more bridges • We will analyze the data • Introduce averages and graphing • Introduce interpolation and extrapolation.
Materials Each group should have: • 6 sheets of 4x11 inch paper • 50 pennies • 1 dixie cup • 2 video tapes • 1 record sheet
Plan for our experiment • When engineers are planning to build something, they need to test the materials they will use to know the abilities of the material. • Today we will test the strength of different thicknesses of paper bridges. • We could also test span length, different materials, shapes, or other properties.
Set up for bridge 1 • Set the video tapes on edge to form a span approximately 9 inches apart. • Fold the right and left edges of the paper to the middle, forming a U shape two inches wide, one inch tall and 11 inches long.
Imagine the cup is inside! • Place the bridge so that the 11 inch bridge spans the video tapes and aligns with their edges. • Place dixie cup gently in the middle of the bridge.
Method for experiment • SLOWLY and GENTLY add one penny at a time to the cup. • Record in the data sheet the number of pennies that it took for the bridge to collapse.
Bridge 2 & 3 • Fold two pieces of paper into the U shape and suspend them, one on top of the other for double thickness, between the tapes. • Again test the collapse weight of the bridge and record the data on the sheet. • Fold three pieces of paper and test a three thickness bridge.
Class record • We will record the data for the class and calculate the average value for each thickness of bridge. • Since data can be varied the averages over many trials should give us a reasonable value.
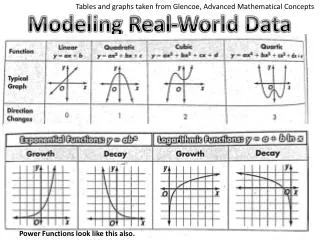
Graphs • A quick way to look at data and analyze results is to graph the data. • Plot the points on the graph paper on your sheet with the thickness on the horizontal axis (independent variable) and collapse weight on the vertical axis (dependent variable). • Draw a line through what seems to be the middle of the points. This is called the line of best fit and it is approximate. (Excel is great at this)
Interpolation and Extrapolation • These are fancy words that mean looking between your data and outside of your data (assuming that the data would continue) • Choose what value of pennies you believe a bridge 1.5 or 2.5 sheets thick would hold. • Determine what value of pennies you believe that a bridge 4 or 5 sheets thick would hold.
Questions and feedback • Was the activity fun? • Would it be easy to do with students? • Is the math understandable? • Is the activity valuable? • Is there anything that we could have done differently?