Download
1 / 1
10 likes | 243 Views
`. Image Registration: Given that these images could be shot through filters located at different locations in space, the images might be oriented in slightly different positions.

E N D
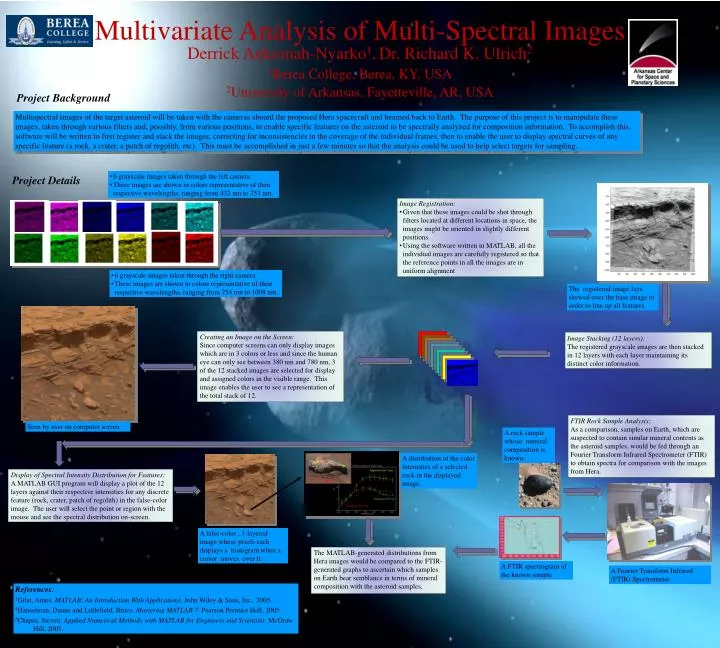
` • Image Registration: • Given that these images could be shot through filters located at different locations in space, the images might be oriented in slightly different positions. • Using the software written in MATLAB, all the individual images are carefully registered so that the reference points in all the images are in uniform alignment Creating an Image on the Screen: Since computer screens can only display images which are in 3 colors or less and since the human eye can only see between 380 nm and 780 nm, 3 of the 12 stacked images are selected for display and assigned colors in the visible range. This image enables the user to see a representation of the total stack of 12. Image Stacking (12 layers): The registered grayscale images are then stacked in 12 layers with each layer maintaining its distinct color information. FTIR Rock Sample Analysis: As a comparison, samples on Earth, which are suspected to contain similar mineral contents as the asteroid samples, would be fed through an Fourier Transform Infrared Spectrometer (FTIR) to obtain spectra for comparison with the images from Hera. Display of Spectral Intensity Distribution for Features: A MATLAB GUI program will display a plot of the 12 layers against their respective intensities for any discrete feature (rock, crater, patch of regolith) in the false-color image. The user will select the point or region with the mouse and see the spectral distribution on-screen. The MATLAB-generated distributions from Hera images would be compared to the FTIR-generated graphs to ascertain which samples on Earth bear semblance in terms of mineral composition with the asteroid samples. Multivariate Analysis of Multi-Spectral Images Derrick Ankomah-Nyarko1,Dr. Richard K. Ulrich2 1Berea College, Berea, KY, USA 2University of Arkansas, Fayetteville, AR, USA Project Background Multispectral images of the target asteroid will be taken with the cameras aboard the proposed Hera spacecraft and beamed back to Earth. The purpose of this project is to manipulate these images, taken through various filters and, possibly, from various positions, to enable specific features on the asteroid to be spectrally analyzed for composition information. To accomplish this, software will be written to first register and stack the images, correcting for inconsistencies in the coverage of the individual frames, then to enable the user to display spectral curves of any specific feature (a rock, a crater, a patch of regolith, etc). This must be accomplished in just a few minutes so that the analysis could be used to help select targets for sampling. • 6 grayscale images taken through the left camera. • These images are shown in colors representative of their respective wavelengths, ranging from 432 nm to 753 nm. Project Details • 6 grayscale images taken through the right camera. • These images are shown in colors representative of their respective wavelengths, ranging from 754 nm to 1009 nm. The registered image lays skewed over the base image in order to line up all features. Seen by user on computer screen A rock sample whose mineral composition is known. A distribution of the color intensities of a selected rock in the displayed image. A false-color , 3-layered image whose pixels each displays a histogram when a cursor moves over it. A FTIR spectrogram of the known sample A Fourier Transform Infrared (FTIR) Spectrometer References: 3Gilat, Amos. MATLAB: An Introduction With Applications. John Wiley & Sons, Inc., 2005. 4Hanselman, Duane and Littlefield, Bruce. Mastering MATLAB 7. Pearson Prentice Hall, 2005. 5Chapra, Steven. Applied Numerical Methods with MATLAB for Engineers and Scientists. McGraw Hill, 2005.