Download
1 / 8
110 likes | 284 Views
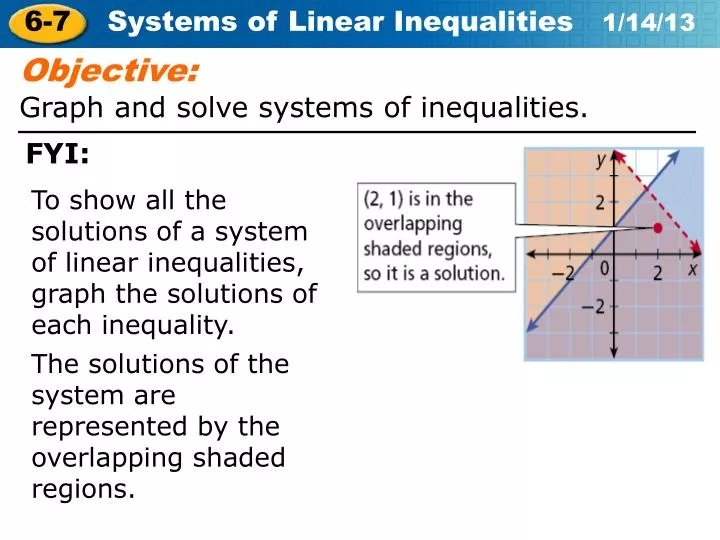
Objective: Graph and solve systems of inequalities. FYI:. To show all the solutions of a system of linear inequalities, graph the solutions of each inequality. The solutions of the system are represented by the overlapping shaded regions. Dashed line Shade below line. y <. Dashed line

E N D
Objective: Graph and solve systems of inequalities. FYI: To show all the solutions of a system of linear inequalities, graph the solutions of each inequality. The solutions of the system are represented by the overlapping shaded regions.
Dashed line Shade below line y < Dashed line Shade above line y > Solid line Shade below line y ≤ Solid line Shade above line y ≥
y ≤ 3 y < –x + 2 Example 2A: (Graphing Systems of Inequalities) Graph the system of linear inequalities. Graph and shade y 3 Graph and shade y < -x+2 Darken shading in the overlap area
Step 1 Graph and lightly shade 1st inequality Step 2 Graph and lightly shade 2nd inequality Darken where the shading is overlapped – this is the solution area Step 3 Graphing Systems of Linear Inequalities
y ≥3x – 2 y > –x Example 2B: (Graphing Systems of Inequalities) Graph the system of linear inequalities. Graph and shade y ≥ 3x - 2 Graph and shade y > -x Darken shading in the overlap area
y >2x y < –2x + 1 White Board!(Graphing Systems of Inequalities) Graph the system of linear inequalities. Graph and shade y > 2x Graph and shade y < -2x + 1 Darken shading in the overlap area
y ≥2x y ≤ 2x – 3 White Board! (Special Systems of Inequalities) Graph the system of linear inequalities. Graph and shade y ≥ 2x Graph and shade y ≤ 2x - 3 Darken shading in the overlap area There is no overlap area No Solution
Assignment: Worksheet 6-7