Download
1 / 22
230 likes | 478 Views
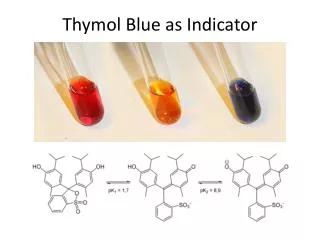
Comparative effects of A zolla pinnata ( sp africana ) and inorganic Ammonium sulphate on growth and yield of Basmati 370, under varied inorganic phosphate regimes in Mwea & Ahero Irrigation schemes Oyange A. W Dr. Kanya ,. A zolla as indicator of P levels in Paddy.

E N D
Comparative effects of Azollapinnata (spafricana) and inorganic Ammonium sulphate on growth and yield of Basmati 370, under varied inorganic phosphate regimes in Mwea & Ahero Irrigation schemes Oyange A. W Dr. Kanya,.
INTRODUCTION • Azollaspecies is a leaf floating fern and forms symbiotic ass. with a Cyanobacterium(Anabaena azollae). • The association with the cyanobacteria plays a very important role in rice production. • For centuries, Azolla and its nitrogen-fixing partner Anabaena have been used as "green manure. • Industrial revolution reduced the traditional use of Azolla as green manure due to Increase in supply of chemical fertilizers. • In1970’s oil crisis had negative impact of inorganic fertilizers leading to intensified research on Azolla
INTRODUCTION • In Mwea Irrigation scheme, Azollapinnatais widespread, • Invasion noticed in early 1990’s, source is unknown • Coverage stands at 30-50% during the peak season • The heavy bloom of Azollais enhanced by perennial application of P fertilizers to levels equivalent to 45 kg P2O5 ha-1 • The presence of Azollais aggravated by; • land preparation practice(3 months early • maintenance of flooded paddies (BL survey, 2012)
INTRODUCTION • Azolla incorporation (“Isahan” ) contributes nearly 45% of the soil N in MIS. • Research: 1970s, confirmed the bio-fertilizer potential of Azolla • AIRS reported same in 1980’s • Azolla provides organic fertilizers, increases efficiency of nitrogen use, & reduces water pollution • Azollacan increase rice ylds by 158% & no decline in pdtivity, no need of rotation.
INTRODUCTION • The N requirement for Mwea is 60-80 kg ha-1 • Current soil N levels are as high as eqv. to 35 kg N ha-1 • Other benefits; low incidents of malaria in Mwea • Potential of Azolla is high, can reduce reliance on inorganic fertilizers,(20% of the pdn cost) • Most research data available related to experiments in Asian countries • A two year field experiment on the comparative effects of Azolla and AS on rice Basmati 370 will be conducted at MIAD and AIRS.
Justification • Azolla is widely spread( 30-50% at peak in MIS • Cost of fertilisers high and on the increase (20% of pdncost. • Chemical fertilizers have effects on soil fertility, productivity and environmental degradation. • Need for a complemented, sustainable agriculture, with low risk of environmental effect. • Azolla-Anabaenasystem provides an alternative use of bio fertilisers. • It is an option, wholly or complementarily as a fertilizer especially in MIS
GeneralObjective Determine the bio-diversity and comparative effects of Azolla organic fertilizer source and SA, on growth & yield of Basmati 370. Specific objective • Identify the bio-diversity of Azolla in Kenya • Find the effects of Azolla “green manure” and SA on growth and yield of Basmati 370 • Establish the effects of timing of incorporating Azollabiomass on growth and yield of Basmati 370 • Determine the effects of P and K on growth of Azollabiomass & the rate of xn with time.
MATERIALS AND METHOD MIS & Ahero • Within AEZ LM3 & LM4 (marginal cotton zone) • Rainfall is bimodal 930mm/yr with 510mm during long season with 66% reliability. • Temperature ave. 22oC with min 17 & max of 28 oC • Soils are vertisols, imperfectly drained • Weather data to be taken and soil analysis done
Experimental procedure • 2 experiments will be done; • Basmati 370 to be grown at 30 x15cm, 2 N levels, 2 P levels and 3 timings of Azolla applications split plot design. • N levels will be the main plot while P and timings of Azolla application will be the sub plots. • K will be applied at standard rate of 50 kg ha-1 • 3 factor, 3 x 2 x 2 factorial exp in 3 reps • N levels will be N1 & N2,(0 and 60 kg ha-1) P as P1, P2 (0 and 50 kg ha-1 P2O5) Timing as T0 , T1 , and T2 ( non, Basal , at veg
Treatments & treatment combinations Where ; N1- 0kg N ha-1, N2-60kg N ha-1, P1- 0kg P2O5 , P2- 60kg P2O5 T1- No appn, T2- basal, 60kg biomass, T3- 60g inoculation/plot
Plot Layout R1 R2 F3 Split plot design; N- Main plots and P & T sub plots, all randomized in 3 replications
Data collection Growth parameters • Plant Height (cm) • Chlorophyll content • Tillers m-2, • Dry weight Yield parameter • Panicle number m-2 • Spikelet paniclem-1 • % ripened grain • 1000-grain wt(g) • Yield (tons ha-1) • Growth observations taken at 21, 30, 45, 55 & 75 DAT
Experiment 2 (Pot) • 10 g of Azolla biomass inoculated 8.4 x 10⁻³ m3 (30.5cm x11.5 cm) for 10 days • Use Canal and tap water -W1 and W2. • 4 P levels; P1, P2, P3, P4 • 2 K levels- K1 & K2 • 2 factor, 4 x 2 factorial in split plot design, 3 reps • P1, P2, P3 andP4- are0, 50,75 and 100 kg ha-1 P205, • K1 and K2 are 0 and 50 kg ha-1 K20. • W1 - Canal water & (W2) Tap water • The N, P, K, pH of W1 and W2 analysed
Design & Layout Azolla biomass will be measured on the 10th day after inoculation N, P and K contents of the biomass analysed
Data Analysis • Data was collected, summarized in excel & analyzed using SPSS & SAS. • ANOVA at 5% sig. used to assess main & interactive effects • Means for the treatments, separated using LSD Test.


![Why use [CII] as a SFR indicator?](https://cdn2.slideserve.com/3620152/why-use-cii-as-a-sfr-indicator-dt.jpg)