Download
1 / 7
70 likes | 144 Views
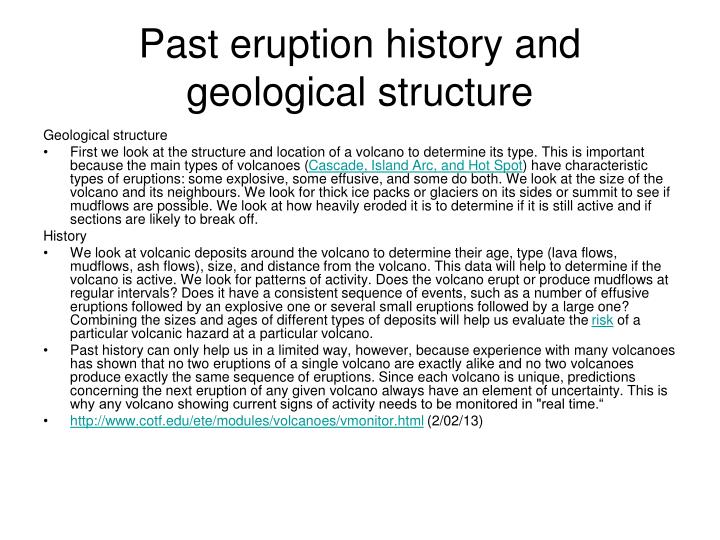
Past eruption history and geological structure. Geological structure

E N D
Past eruption history and geological structure Geological structure • First we look at the structure and location of a volcano to determine its type. This is important because the main types of volcanoes (Cascade, Island Arc, and Hot Spot) have characteristic types of eruptions: some explosive, some effusive, and some do both. We look at the size of the volcano and its neighbours. We look for thick ice packs or glaciers on its sides or summit to see if mudflows are possible. We look at how heavily eroded it is to determine if it is still active and if sections are likely to break off. History • We look at volcanic deposits around the volcano to determine their age, type (lava flows, mudflows, ash flows), size, and distance from the volcano. This data will help to determine if the volcano is active. We look for patterns of activity. Does the volcano erupt or produce mudflows at regular intervals? Does it have a consistent sequence of events, such as a number of effusive eruptions followed by an explosive one or several small eruptions followed by a large one? Combining the sizes and ages of different types of deposits will help us evaluate the risk of a particular volcanic hazard at a particular volcano. • Past history can only help us in a limited way, however, because experience with many volcanoes has shown that no two eruptions of a single volcano are exactly alike and no two volcanoes produce exactly the same sequence of eruptions. Since each volcano is unique, predictions concerning the next eruption of any given volcano always have an element of uncertainty. This is why any volcano showing current signs of activity needs to be monitored in "real time.“ • http://www.cotf.edu/ete/modules/volcanoes/vmonitor.html (2/02/13)
Chemistry • Usually gases are discharged through gas vents (fumaroles) and we can measure the temperature and composition of these gases by taking regular samples. As magma rises in the volcano, the temperature of fumaroles may increase, and their chemistry will change. Sometimes the gases emerge under a lake, or interact with groundwater in the volcanic edifice. Also the heat from the rising molten material can heat the ground water to form hot springs and lakes. • Changes in the water chemistry of crater lakes and thermal spring waters are used to detect changes in the behaviour of the volcanoes and their associated geothermal systems. Geochemical surveys include sampling of selected springs, lakes and streams at places like White Island; Tarawera (hot water beach); Red Crater and Central Crater on Tongariro; and the Crater Lakes of Ruapehu and White Island. • Monitoring specific water parameters such as temperature, pH, conductivity, and concentrations of dissolved gases can provide insight into the processes expected to accompany unrest or renewed volcanic activity. Changes in groundwater, lake levels, rates of stream flow can also give evidence of unrest within a volcano. Crater lakes in particular are valuable indicators of the status of volcanic systems. For example, at Ruapehu we often see the magnesium concentrations increase if new/fresh rock is made available to the crater lake waters. http://info.geonet.org.nz/display/volc/Chemistry (6/02/13)
Gas Monitoring - Monserat • Measurements of the gas emissions from the volcano have been carried out throughout the eruption. These measurements have constituted an important input to the assessment of volcanic risk. Sulphur dioxide (SO2) and hydrogen chloride (HCl) are the species routinely monitored, primarily by remote sensing techniques. • Sulphur dioxide emission rates were initially measured using a correlation spectrometer (COSPEC) from July 1995 through to December 2001. The COSPEC utilizes a sulphur dioxide absorption feature in the ultra violet (UV) spectrum. It does so by capturing sunlight via an upward pointing telescope. Measurements were taken 2-5 times per week, using car, boat or the helicopter as a platform for horizontal traverses under the gas plume. On rare occasions a fixed scanning technique is employed, this involves mounting the (COSPEC) instrument on a tripod and manually rotating the instruments telescope, perpendicular to the plume axis. • A new technique for measuring SO2 flux (DOAS) involving the use of miniature ultraviolet (UV) spectrometers was first tested in August-September 2001 in the traverse modes (similar to COSPEC), then deployed in full at the beginning of 2002 in fixed scanning modes. This new technique comprises of a network of three spectrometers in fixed positions scanning the sky between the hours of 8am-4pm each day. The data is continuously telemetered back to the MVO. This thus provided a more continuous SO2 dataset relative to the sporadic (COSPEC) measurements of before. • HCl emission rates have been measured indirectly using open-path Fourier Transform Infrared spectrometer (FTIR) measurements to obtain HCl: SO2 mass ratios in the plume allowing HCl emission rates to be calculated from SO2 flux rates obtained from the UV spectrometers. The mass ratio itself may be the most revealing piece of information and may be used to evaluate changes in eruption rate and growth of the dome. The emission rates of HCl and SO2 have also, most importantly, become a valuable indicator of pauses in dome growth • http://www.mvo.ms/science/monitoring/1445-gas-monitoring (6/02/13)
Gas monitoring • http://info.geonet.org.nz/display/volc/Gas (6/02/13)
Seismic monitoring Diagram from: http://www.mvo.ms/science/monitoring/1444-seismic-monitoring (5/03/13)
Seismic monitoring • The signals from volcano-tectonic (VT) earthquakes have a sudden start and last for a short time. They are predominantly high frequency signals (2 Hz) and often occur in swarms lasting from an hour to several days in duration. VT earthquakes are caused by the fracturing of the rock under the volcano as the magma forces its way to the surface. They were common at the start of the eruption and now occur much more sporadically. VT earthquakes can be located using MVO's seismic monitoring network and generally occur beneath the summit of the SHV, at depths between 0 and 7 km. Early in the eruption, some VT swarms were located under St. George's Hill and to the northeast under Long Ground. • Long period (LP) earthquakes have a more emergent start and a lower, narrow-band frequency content (1-2 Hz). These are probably caused by resonance in the gas or magma inside the volcanic conduit. It is normally not possible to locate LP earthquakes. • A hybrid earthquakes is, as the name suggests, a mixture between a VT and an LP. They tend to have impulsive starts but contain a significant amount of low frequency signal. They are thought to represent magma forcing its way to the surface and are often associated with periods of rapid dome growth, and are sometimes precursors to major dome collapses, or switches in the direction of lava extrusion. These signals often merge into continuous tremor, which sometimes occurs in bands 4-24 hours apart. • Rockfall or pyroclastic flow signals have often been the dominant type of seismic signal. They have an emergent start and a wide frequency range. They are interpreted as due to material falling off the dome and traveling down its flanks. Signals from pyroclastic flows are similar but are of longer duration and higher amplitude. • Mudflows can create seismic signals that can be confused with pyroclastic flow signals, although they are generally of lower amplitude and longer duration. These signals usually build-up gradually and are stronger at stations close to ghauts (valleys). • http://www.mvo.ms/science/monitoring/1444-seismic-monitoring (5/02/13)