Download
1 / 20
200 likes | 365 Views
Calo preparation for 2015. Goals: Trigger stability Good calibration for HLT2 processing Improved calibration ( timing, e/gamma response ) for all calo sub-detectors Improved monitoring. Calibration workshop 8/10/2013. The hardware changes :

E N D
Calo preparation for 2015 Goals: Trigger stability Good calibration for HLT2 processing Improved calibration ( timing, e/gamma response) for all calo sub-detectors Improved monitoring
Calibration workshop 8/10/2013 • The hardware changes : • DamagedEcal LED fiberswillbechanged -> improved gain monitoring (Iouri) • Exposed PMT willbereplaced ( hundreds) • The current calibration scheme for ECAL/PRS • Initial calibration from pi0 fine calibration (D.Savrina) using FMDST available ~ 4 weeks of data taking • Minimum biais events . Lowenergy in PS • ~ 80M eventsneeded • Iterativeprocedure • The more precisemethod • Ageingeffectcorrectedfrom e/p of tagged conversions 55 sets in 2013 (MNM) • Calibration fromelectronprovidealso calibration constant also for pre-shower. (O. Steinakin) availableonlyafter reconstruction. • Analytic solution • The current calibration scheme for Hcal • Ageing monitoring through LED response (2012) • PMT change whendeviationabove certain threshold • Controlled by Cs source run ( every TS) • Fine Hcal calibration on reconstructed data :100-200M eventsneeded to get a cell/cell calibration.
LED system: HCAL 2012 LED-based HV corrections (17) Cs calibrations (3) sum/sumref, 56 central cells shutdown137Cs calibration TS1, 137Cs calibration TS2, 137Cs calibration TS3, 137Cs calibration results of Cs calibrations at TS is used as a starting point, then LED-based corrections total of 4 Cs calibrations and 17 LED-based corrections Precision of LED corrections is limited by: annealing during TS (and faster ageing afterwards) - PMT rate effect – variation within fill (can be optimized by regrouping PMTs, to be done @ LS1) uncertainty in the “plastic ageing” prediction – non linearity, annealing (the attempts to take the plastic ageing into account are visible) Yu. Guz 2013/10/09
OccupancyMethod & dependence • For eachcellcalculate the occupancy ratio : - Threshold to bedetermined – Precision to bereached 1-2% Irina Machkhilyan LHCb-INT-2013-050 Calo meeting presentationsfrom Irina in each calo meeting since July 2012. http://indico.cern.ch/contributionDisplay.py?contribId=9&confId=217410 http://indico.cern.ch/contributionDisplay.py?contribId=8&confId=235526 http://indico.cern.ch/contributionDisplay.py?contribId=7&confId=244405 http://indico.cern.ch/contributionDisplay.py?contribId=5&confId=252503 http://indico.cern.ch/contributionDisplay.py?contribId=6&confId=260472
Occupancy ratio #filldependence • - Dependsupon the fillm • Stable period in m to beused • Depends of the trigger type -> Minimum biais • 85 Hz for 8 hoursfillenough to reach • a 1% precision • - Magup/Magdownreference MagDown Magup
Can beextended to Hcal Hcal / LED response Ecal/LED correlated to HV change
PRS case Determination of the integration range complicated By the scale change of the adcspectrum . Checked on data as well.
Method’schecks on 2012 data * Severalrunused to calculate the correction fromoccupancy . Bothpolarity Reference are in italic
Ecal • E/p fit
Hcal On rawHcal fluctuation at 2% level . More investigation on PMTsaffecting the trigger The accuracy of the methodcanbecompared to the LED Removing the Hcal HV change effectcalculatedfrom LED
PS • E/p for electrons • Ecaloccupancy correction applied • Ecal & PS occupancy correction applied • Overcorrectionwhenboth are applied: • To beunderstood • Impact on L0 to beinvestigated but isexpected to besmall. Ecalcorrected Ecal +PS corrected
For 2015 • 85 Hz minimum biais needed ~ 300K /hour • 1 :1.5 % precision all over the calorimeter (10 hours) • 2 consecutivefillcanbeused • Choose stable m period • Raw information shouldbeavailable for end of fillprocessing • Builttools able to determinerunswith stable mu • 2 options • Correction table / cell • HV change – preferredwillsolve the trigger instability • Cannotbereversed • PMT HV curvesused • With new LED system the ageing amplitude canbemonitored and used to cross check occupancy changes. • Initial calibration needsothermethods • P0 (Ecal) • Electrons (Ecal +PS)
Is it possible ? • Need 85Hz of minimum biais event to calculateoccupancycell by cell ( occupancyfarm ?) • Analyse eventsonly in mu stable condition • Referencedependsupon the magneticfield • The PMT HV canbeupdatedwhen the deviation > 2-sigma of itsresolution • Possible to check the agreement with LED measurement (Ecal & Hcal) • This methodhad been used in November 2012 to update Ecal HV • It willremove the ageingdependancefrom trigger • Is it possible to fit with the new HLT1/HLT2 scheme • It has to becompleted by fine calibration • To bechecked in eventreplaying mode . ( 1st 2014 half)
Data qualitycontrols • Improved data quality to point wrongbehavior: • On line (in investigation) : • The possibility to use the 85 Hz mimimum biais event to check the pi0 mass reconstruction as done in the fine calibration: with or withoutiterativeprocedure • e/p per zone for conversion to become standard plots • Pi0 Mass /zone willalsobecome standard DQ plots • e/p on hadronicchargedtracks • Currentdevelopement ( available in 2014) • Retuning of all corrections for electrons and pions • Clustering (2x2 investigate for the upgrade ) • Initial precise calibration will come from pi0 , electrons , hadrons: FMDST schemestillneeded.
2012 procedure • Reference calibration fromreconstructedp0 • Processingusing the current calibration • Extract correction coefficient (Dasha) • Need FMDST to beavailable • Processing 2 weeks Referenceused All 1
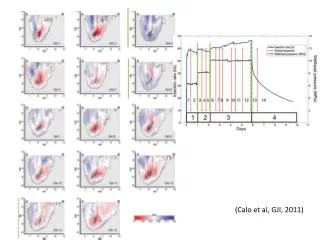
Ageing trend general The correction are dominated by the higher flux in each zone. They correspond to higherageing. Fraction gain lost HV change end of august ~1% /100pb-1 HV change: occupancymethod End of November . Back to initial calibration. ~0.4%/100pb-1 Annealingeffect : Christmas stop 4% annealing in average Lumi (pb-1)
E/p for electron (O.Steniakin) Fine calibration applied on alreadycalibrated data
HCAL E/p calibration: track selection • For all tracks from Rec/Track/Best : • find associated cells in HCAL, ECAL, PS laying at the track extrapolation; calculate E(HCAL), E(ECAL), E(PS) • using the CaloEnergyForTrack tool (Vanya) (AddNeighbors=1) • keep only tracks with E(HCAL)>0 • require isolation in HCAL (no HCAL cells associated with given track is shared with any other track); • keep only long tracks, -200<z<400mm • reject muons (tight and loose) • reject protons (by RICH): the HCAL responses to and differ, which distorts calibration • require E(ECAL) < 800 MeV && 0< E(PRS) < 20, to reject showers started much before HCAL • The track position in HCAL is defined as the position of a cell with max energy deposition. • further refinement: • cut on ptrack: 7 GeV for all cells, somewhat higher for the innermost ones • (safety) cut on E(HCAL): 2.5 GeV for all cells, somewhat higher for the innermost ones Yu. Guz 2013/10/09
HCAL response to hadrons, data More uniform than response to muons: ~4% RMS for both inner and outer (borders excluded). Yu. Guz 2013/10/09