Download
1 / 20
200 likes | 289 Views
Explore the economic impacts of climate change on poultry production, managing carbon emissions, operational boundaries, reporting programs, carbon labeling, trading, and pricing, highlighting the business case and risk assessment for sustainable practices. Learn how sustainability can lead to innovations and cost savings.

E N D
Poultry – Carbon inventory introduction • Site / company name and logo here • Presenter/s names here This is an AgriFood Skills Australia Ltd project developed in partnership with Energetics Pty Ltd and funded by the Australian Government under the Clean Energy and Other Skills Package
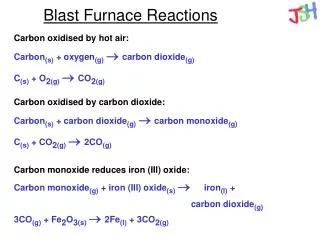
What is the problem? • Climate change • Resource depletion • Energy • Water • Materials • Increased emissions, contamination & waste • Reduced air quality • Loss of biodiversity
Risks specific to Australia • Energy pricing • Low energy costs, greenhouse intensive coal sources • Costs to increase – oil prices, carbon, lack of investment, drought conditions • Access to Water • Australia is the driest continent on earth • Many industry sectors are dependent on access to water for operation. • Regulatory uncertainty • Carbon Price and Emissions Trading. • Uncertainty - difficulty in long-term infrastructure/ asset planning. • Market related risks • Climate change risks in other countries may differ remarkably – regulations, consumer behaviour
Things to consider when managing carbon – organisational boundaries Decisions must be made as to how emissions will be aggregated. Three approaches include: • Equity share • Financial control • Operational control Operational control is default boundary! – required for reporting to Australia’s National Energy and Greenhouse Reporting System (NGER) What is operational control? Defined in Australian law as the right to introduce or implement operating, health and safety or environmental policies
Things to consider when managing carbon – operational boundaries Scope 1“Fuel You Burn” Scope 2 “Fuel burnt for You” Scope 3 “Emissions from services You use and products You produce” LPG Nat Gas Petrol Process emissions Electricity
Reporting / reduction programs • NGER (Australian) – Mandatory reporting of national energy consumption and production and greenhouse gas emissions above legislated thresholds. • EEO (Australian) – Mandatory identification of energy efficiency opportunities by energy users above thresholds. • CDP (International) – Voluntary requests for greenhouse and energy disclosure from over 2,500 organisations. CDP acts on behalf of 534 global institutional investors NB: No longer considered “voluntary” for Australia’s top 200 companies
The business case for carbon management– emissions & profit Figure 8: Carbon intensity by sector (VicSuper Carbon Count 2009)
The business case for carbon management – carbon labelinguk carbon trust • Aldi – first company in Australia to introduce Carbon Reduction Labels. • Suppliers now required to • report GHG emissions • commit to GHG reductions Woolworths and the Australian Food and Grocery Council conducting study on benefits of carbon labeling .
The business case for carbon management – carbon trading • Japan – currently designing ETS that is likely to be implemented in 2011 • NZ – ETS started 1 July 2010 • China - likely to have an ETS • EU – existing ETS may legislate a 30% reduction target • UK Coalition - setting a floor price for carbon • US – multiple regional ETS’ From 1 July 2012 – Australia has a price on carbon set at $23 per tonne of CO2-e – following a number of other countries NB: Emissions trading works: EU verified emissions showed a decrease of 11% in 2009
The business case for carbon management – carbon price Some pay directly eg. Large users of coal such as coal fired power stations Q: Who pays the Carbon price? Some pay indirectly eg. Consumers of electricity / smaller users of fuels Think petrol excise – you pay, but payment collected upstream
The business case for carbon management – what level of price? NB: Very costly for some Costs spread across the economy
Risk and opportunity identification These include: • Physical – damage to functioning of assets / take advantage of shifting climatic zones • Regulatory – exposure to / seize opportunities around: - current and future requirements; - administrative burden; - direct and pass-through carbon price costs • Litigation – CEO liability or opportunity (NGER and EEO) • Competitive – business environment will change – advantage or risk? • Reputational – information is in public domain
The business case for carbon management Experience shows that sustainability makes good business sense • Embedding sustainability within an organisation’s broader business strategies frequently results in organisational and technical innovations that generate both top- and bottom-line returns. • Reducing inputs to a business, due to a carbon-constrained economy, reduces costs. • Reducing inputs requires new or improved products or even new business lines.
Additional slides for management presentation • Insert following slides as required
Summary graph from baseline tool Insert summary graph from baseline tool
The size of your footprint Insert summary graph 1 from inventory
Scope 1 v scope 2 emissions Insert Summary graph 2 from inventory
Energy use by emissions source Insert summary graph 3 from inventory
Carbon price impact • Insert summary slide 4 from inventory