Download
1 / 52
560 likes | 761 Views
IUCN’s Red List of Ecosystems: An Evolving Tool for Risk Assessment to Support Priority Setting & Landscape Action. Edmund Barrow ( Ecosystem Management Programme), Jon Paul Rodríguez & David Keith ( Commission for Ecosystem Management) TCD Dublin May 2013.

E N D
IUCN’s Red List of Ecosystems: An Evolving Tool for Risk Assessment to Support Priority Setting & Landscape Action Edmund Barrow (Ecosystem Management Programme), Jon Paul Rodríguez & David Keith (CommissionforEcosystem Management) TCD Dublin May 2013
www.iucnredlistofecosystems.org • Documents, support, case studies, communications. • English, Spanish and French. IUCN Red List of Ecosystems
IUCN Red List of Ecosystems @redlisteco
Complement to IUCN Red List of Threatened Species (http://www.iucnredlist.org/)
Red Lists and Red Data Books of Threatened Species • IUCN maintains threatened species lists since 1950s. • “Red Data Books” popularized in 1960s: birds & mammals. • “Information explosion” in 1990s: • Europe: 3,562 known red lists. • >100 countries have produced RL for at least one taxon (www.nationalredlist.org).
1990s: major paradigm shift • Species assigned to categories on the basis of quantitative criteria and thresholds. • Separation of risk assessment (scientific) from definition of conservation priorities (societal process).
Quantitative criteria: Categories for IUCN red lists Georgina M. Mace Russell S. Lande Population decline Critically endangered Small range: fragmented / decline / fluctuation Thresholds Endangered Reproductive population small and declining Very small or restricted population Vulnerable Quantitative assessment
Extinction Risk Conservation Priorities Distributional Factors Weighting system Biological Factors Conservation priorities Societal Values Logistical Factors Economic Factors Analysis, studies, choices, politics, land use etc Other Factors (legal, institutional, etc.)
Extinction risk vs. Conservation Priorities Anopheles sp. http://www.kingsnake.com/westindian/icterusicterusridgwayi2.JPG http://pathmicro.med.sc.edu/parasitology/mal8.jpg http://ucce.ucdavis.edu/files/filelibrary/5434/19394.jpg Least Concern Troupial Icterus icterus
Motivation for a “Red List” categories system for ecosystems • Abundant experience with red list categories for species. Red list “explosion” world-wide (> 100 countries have applied them). • Increased capability of geographical information systems: • more powerful and inexpensive computers. • cheaper and more user-friendly software packages (Quantum GIS – free). • Increased availability of remotely-sensed data, covering 20-40 years.
Why focus on ecosystem status? • May more effectively represent biodiversity as a whole than individual species. • Ecosystem loss more apparent than species loss: clean water, food, fuel – service losses • More time-efficient than species-by-species assessments (<3% species evaluated by IUCN). • Ecosystem loss and degradation might precede species declines (e.g. extinction debt). • Combined with species Red List, more powerful assessment of biodiversity status.
Official listing of threatened ecosystems is already taking place • Gov. of W. Australia: quantitative categories & criteria for threatened ecosystems, also Victoria. • S. African National Environmental Management: Biodiversity Act: identification of over 200 threatened ecosystems. • Austria, Germany, Finland, Norway & partially in other EU states(based on NATURA 2000, EUNIS). Venezuela, Senegal (draft); and • Colombia, Bolivia, Chile, Costa Rica, Ecuador, Peru in process • EC about to launch a tender for Red List of Habitats for Europe process
Mandates from the IUCN World Conservation Congresses (Barcelona 2008, Jeju 2012) • Consolidation of the IUCN Red List of Ecosystems: • Formal adoption of RLE categories and criteria. • Formal allocation of funds/staff. • Global assessment of ecosystems. • Provision of support to national assessments. • View RLS and RLE as an integrated tool(also with other IUCN key Knowledge Products).
Major scientific challenges • What is an ecosystem? • When is an ecosystem “extinct”? • Disappearance, transformation or collapse? • How to assess ecosystem change? • distribution • function
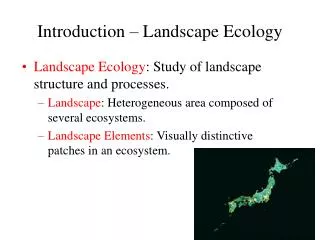
I. Defining ecosystems No global classification (but maybe getting nearer), ecosystems may be defined at various scales (raindrop to biosphere) Approach: • Adopt widey accepted conceptual definition (Tansley 1935, Odum) • Develop a risk assessment method applicable to any classification (national, regional) • Promote development of a global ecosystem classification • Require documented ecosystem descriptions as part of each risk assessment
Describing ecosystems for assessment • Description template (operational) • Classification (IUCN habitats, etc) • List defining biotic features • Identify defining abiotic features • Describe key ecosystem drivers • Maps (time series, projections) • past, present, future Conceptual definition (4 key elements,Tansley 1935) • characteristic assemblage of biota • associated physical environment • processes & interactions between components • among biota • between biota & environment • Spatial extent
Defining ecosystems – Our Operational basis • Specific set of ecosystems that can be nested (local, national, global) use of different schemes – c.f. NatureServe (Classification & Description of World Formation Types); EUNIS • Nesting into administrative & other means of dividing – e.g. overall major ecosystem types in a country, or a district, or land/water use • Trade-offs between conceptual definitions & practical reality! • We respect & will use national ecosystem classifications, but will seek to nest them
Data integration, nesting & access NatureServe
Data integration, nesting & access NatureServe
Coming to Global consensus on Ecosystems – but not there yet!
II. The concept of ‘risk’ RISK – the probability of a bad outcome over a specified time frame Define the bad outcome • An endpoint to ecosystem decline • Ecosystems rarely disappear or go “extinct” (cf. species) • “Collapse”: transformation of identity, loss of defining features (characteristic biota & function), replacement by a novel ecosystem (e.g. invasives, agriculture, plantation)
II. The concept of risk • RISK – the probability of a bad outcome over a specified time frame • Specify the time frame for assessing change • long enough to detect trends, • short enough to inform action, • long enough to consider lags & debts • past, present, future
III. Assessing ecosystem change Guiding principles for design of a protocol • Evidence-based risk assessment using all available data & information • Transparent derivation from relevant ecological theories • Generic concepts and methods adaptable across a range of organisational & spatial scales and all ecological domains • terrestrial, freshwater, marine, subterranean • Logically consistent with IUCN Red List criteria for species
Threatening processes Ecosystem distribution Ecosystem function A Declining distribution C Environmt’l degradation Risk of loss of characteristic native biota D Altered biotic processes B Small distribution E Quantitative risk analysis Threatening processes III. Assessing Ecosystem Change Risk model for ecosystems: • threats to defining features (distribution, biota & function) • multiple mechanisms (causes of threat) • 4 symptoms (of decline) = 4 criteria • plus one overarching criterion (probability of collapse)
Categories CO CR Collapse Critically Endangered Endangered Vulnerable Near Threatened Least Concern (so reward, PES) Data Deficient Not Evaluated Threatened EN VU NT LC DD NE
Example of Senegalat National, Ecosystem or Administrative levels Barkadji district CR EN VU LC NE
1987 Barkedji District RLE in N.E. Senegal – RLE at different scales RLE for District 2009
A. Decline in distribution • Change in wetland distribution • 1960 – 2000 • Contraction • Expansion • Time series data (maps, sightings) 2 observations • Data quality & interpretation are important • “garbage in, garbage out” 10% net increase in distribution (Keith et al. 2010) Criterion A = Least Concern
Extent of Occurrence (EOO) Area of Occupancy (AOO) B. Restricted distribution Minimum convex polygon c.5000 km2 Estimating distribution size • “risk spreading” against spatially explicit threats • 2 metrics: polygon(EOO), grids(AOO) • subcriteria • qualitative evidence of decline • exclude small fragments • 1% occupancy rule • scale-sensitive • standardised methods of (spatial) estimation • broad/fine ecosystem units Endangered: B1 & B2 10km cells occupied (46) occupied >1% (12)
Criteria C & D: functionaldecline- degradation of abioticenvironment (C) - disruption of bioticprocesses (D) Varied pathways of functional decline • Relative severity • Extent (% of distribution) • Immediacy • Current • Future • Historic
E. Quantitative analysis of risk of collapse • Enablessynthesisacross all threats & mechanisms of collapse • Ecosystem simulation models • Simple scalarmodels • State transition models • Complex flux models (trophic, energy, matter) • Varied data requirements • Progress: one pilot study, researchproposal
Risk assessment outcomesex. Caribbean coral reefs Overall status is EN-CR based on current & historic declines in coral cover • Disease mgt, climate adaptation A DD DD DD LC LC LC NE Sea Surface Temps need further interpretation NE NE VU-CR, observed decline in coral cover DD EN hindcast decline in coral cover DD B C D Photo: M.Spalding E
Communication / support - plans • IUCN Red List of Ecosystems: Categories, Criteria and Guidebook in English, French and Spanish. • Website (CEM website initially to stand alone), with content (English, Spanish and French): • Reference documentation (e.g. guidebook, scientific articles). • Portfolio of case studies, using a standard format. • Set of presentations for training (in PowerPoint or using other web-based tools). • Support: Ecosystem Red List task force, staff & core stable funding.
Plannedorganizationalstructure RLE Joint product of EMP and CEM • 8-10 members • Expertise from all biological realms and geographical regions. • Oversees entire process, including listing challenges and interpretation of categories and criteria. • Members from EMP, CEM, SSC and others. Functional day to day core group 3-5 people
By 2025, we aim to assess the conservation status of all of the world’s terrestrial, freshwater, marine and subterranean ecosystems.
Conservation Biology 25: 21-29 (2011) Open access
IUCN RLE consultation 2011-2012 18 workshops 17 conferences • 20 countries • 5 continents
Data integration and access Ecosystem classification
Data integration and access Ecosystem classification Ecosystem classification Taxonomy
Data integration and access Ecosystem classification Ecosystem classification Taxonomy
Past, present andfuture 2008: Process begins at Barcelona WCC. 2009: IUCN Red List Thematic Group established. 2010: Draft red list categories and criteria available. 2011: Global consultation and testing initiated. 2013: IUCN Ecosystem Red List Office and Task Force established. 2013: Proposal to IUCN Council for formal adoption of categories and criteria. 2012-2014: IUCN Red List of Continental Ecosystems of the Americas. 2012: Synthesis and presentation at Jeju WCC. 2015: Standardized protocols and on-line tools fully available. 2015-2020: Expansion to other biological realms and regions initiated. 2020: Report on progress towards achieving Aichi Biodiversity Target 5. 2025: First IUCN Red List of Ecosystems completed.
RLE - Opportunities “outside” Conservation • Internationally recognized standard to prioritize & justify Conservation Action & Land Use Management (& investment) at national level. • Criteria for assessment & performance – a decision support approach, basis for negotiated outcomes. • Simple robust way to measure performance, make links with conservation & land use, & reward (Green list). • But need to engage with other – more powerful – bodies (land use, planning, development, Macro-economic planning, political, finance). • Link to good/bad governance.
Linking IUCN Knowledge Products (WCC Jeju) Human Dependency on Nature Red List of Threatened Species Key Biodiversity Areas Ecolex Natural Resource Governance Framework Global Invasive species database Red List of Ecosystems WDPA Protected Planet Conversation underway Being linked Conversation initiated Link in progress Aspirational linkage
From Risk Assessment to Action • High risk of collapse (based on int. accepted RLE criteria) • Why? – analysis, e.g forest clearance, climate change agriculture, poor governance (tenure, rights) • What Action (choice)? – forest restoration, agro-forestry, protected areas, need to assess species at risk (RLS) • Who? People/villages, Gov. • So what? – revisit RLE after X time – changes??
Are there potential KBA’s here, or should be? + potential locus for species assessments + links to Conservation action RLE a basis for spatial overlays of products Are there PAs here, CCA’s – management effectiveness – so conservation action
RLE & Governance – testing the waters! Senegal RLE map + Governance = ?? Koar Nettebulu Missirah Goumbeyel
RLE as one basis for • Impartial means to support safeguards, e.g of WB – risk assessment prior to & if approved, after • Basis to prioritize areas for action (e.g. GEF, multi-lateral, bi-lateral) at local, national and wider levels • Risk assessment highlights need for action – or face loss of services with concurrent economic impacts (ex. of Amboseli) • Links conservation with land/water use • Ability to highlight ecosystems being well managed (e.g. least concern) – PES (e.g. Miyun) • RLE is a tool that can be used at many levels & by different actors (Gov. NGO, Private Sector)
Areas in need of restoration (extensive) VU If water services lost?? Park boundary Riverine area - Agric. Policy, connectivity 50