Download
1 / 8
80 likes | 153 Views
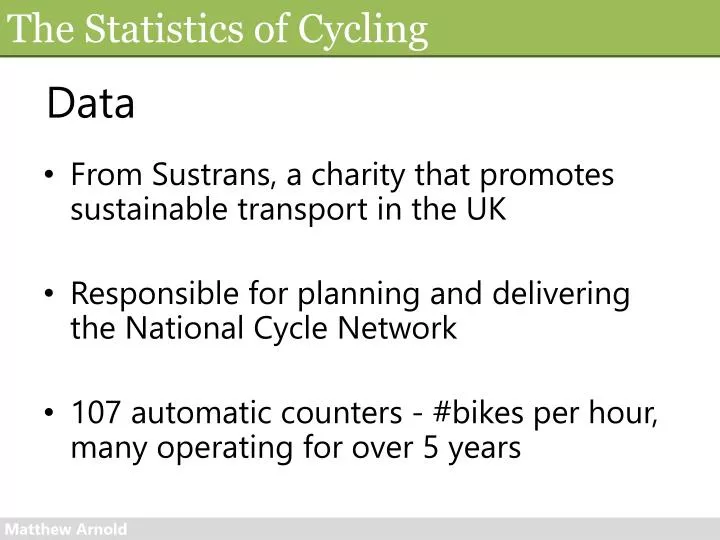
Data. From Sustrans , a charity that promotes sustainable transport in the UK Responsible for planning and delivering the National Cycle Network 107 automatic counters - #bikes per hour, many operating for over 5 years. Usage profiles. Clustering. Try to find common shapes .

E N D
Data • From Sustrans, a charity that promotes sustainable transport in the UK • Responsible for planning and delivering the National Cycle Network • 107 automatic counters - #bikes per hour, many operating for over 5 years
Clustering • Try to find common shapes. • How do we assess dissimilarity? • Hierarchical clustering
Result • 4 shapes • Schools • Commuter • Leisure • Hybrid
Relate to explanatory variables • Responses to Sustrans information about the locality of a counter • Baseline category logit model to “predict” classification. • Response probabilities
Example classification ~ Trafficfreeroute + Lessthan3miles + Lightingno commuter hybrid leisure schools 0.06165034 0.35577006 0.50244144 0.08013816
Conclusions • Confirmed Sustrans notion of 4 types of usage profiles using data-driven methods. • Examined relationship between usage at a counter and the locality of the counter. • Experienced problems due to limited data.