Download
1 / 15
160 likes | 360 Views
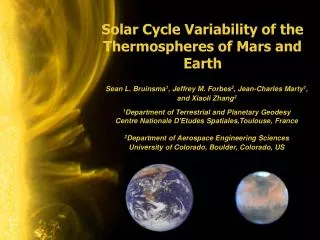
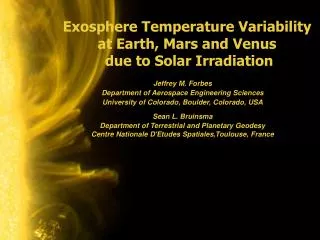
Satellite Drag Variability at Earth, Mars and Venus Due to Solar Rotation. Jeffrey M. Forbes Department of Aerospace Engineering Sciences, UCB 429 University of Colorado, Boulder, Colorado Sean Bruinsma

E N D
Satellite Drag Variability at Earth, Mars and Venus Due to Solar Rotation • Jeffrey M. Forbes • Department of Aerospace Engineering Sciences, UCB 429 University of Colorado, Boulder, Colorado • Sean Bruinsma • Department of Terrestrial and Planetary Geodesy, Centre Nationale D'Etudes Spatiales, Toulouse, France • Frank G. Lemoine • Planetary Geodynamics Laboratory Code 698, NASA Goddard Space Flight Center, Greenbelt, Maryland, USA • Bruce R. Bowman • Space Analysis Division/A9A, US Air force Space Command, Colorado Springs, Colorado 80914 • Alex Konopliv • Jet Propulsion Laboratory, California Institute of Technology, Pasadena, CA. Objective: Utilize thermosphere densities deduced from precise orbit determination (POD)* of the Mars Global Surveyor (MGS), Pioneer Venus Orbiter (PVO) and Magellan satellites, and 6 Earth-orbiting satellites during contemporaneous time periods, to perform a comparative analysis of the satellite drag environments of Earth, Mars and Venus due to the rotation of the Sun. *See papers by Lemoine (this session), Bowman (previous Astrodynamics conferences), and Konopliv on specific POD methodologies for Mars, Earth, & Venus, respectively AIAA/AAS Astrodynamics Specialist Conference, 21 - 24 Aug 2006, Keystone Resort & Conference Center, Keystone, Colorado
Average Temperature Profiles for Earth, Mars & Venus Venus Earth Mars CO2 cooling to space O + CO2 --> O + CO2* CO2* --> IR emission Motivations: In the context of Thermosphere General Circulation Models (TGCMs) (e.g., Bougher et al.), comparative thermosphere data analyses can help to constrain the poorly-known rate coefficient for O + CO2 --> O + CO2* (2) Improved thermosphere density models are needed for aerobraking, re-entry, satellite ephemeris prediction, and mission planning. AIAA/AAS Astrodynamics Specialist Conference, 21 - 24 Aug 2006, Keystone Resort & Conference Center, Keystone, Colorado
Our study focuses on thermosphere density variations related to rotation of the Sun. The Sun’s atmosphere rotates with a period of ≈ 25 days near the equator and 35 days near the poles, with an average rate of ≈ 27 days. This differential rotation causes magnetic field lines to twist, resulting in the formation of active regions that release enhanced solar energy in various forms, including the extreme ultraviolet (EUV) radiation responsible for heating the hot outermost region of a planetary upper atmosphere, the thermosphere (ca. ≥ 100 km for Earth, Mars, Venus). 19.5 nm EUV emission AIAA/AAS Astrodynamics Specialist Conference, 21 - 24 Aug 2006, Keystone Resort & Conference Center, Keystone, Colorado
The rotation of solar active regions produces quasi-27-day periodicities in EUV flux emanating from the Sun and subsequently absorbed by planetary thermospheres. Relatively little is known about the response of Mars’ neutral thermosphere to short-term solar flux variations. Since EUV solar radiation can only be measured from space, the 10.7 cm solar flux that has been observed from the ground for several decades is often used as a proxy for the EUV flux. In our study, the 10.7 cm solar flux (‘F10.7’) measured from Earth is adjusted to Mars and Venus taking into account relative angle and relative distance with respect to the Sun. Quasi-27-day cycle AIAA/AAS Astrodynamics Specialist Conference, 21 - 24 Aug 2006, Keystone Resort & Conference Center, Keystone, Colorado
March 11, 2003 19.5 nm EUV emission March 21, 2003 March 21, 2003 10.7 cm radio flux Day in 2003 AIAA/AAS Astrodynamics Specialist Conference, 21 - 24 Aug 2006, Keystone Resort & Conference Center, Keystone, Colorado
Data Mars: Daily density values at 390 km were inferred from (POD) of MGS during two intervals of particularly pronounced quasi-27-day variability of solar flux: days 75-150 and 270-365 of 2003. Venus: Exosphere temperatures from drag analyses of Pioneer Venus Orbiter (PVO) were obtained directly from the NASA Planetary Data System, for two daytime intervals: days 100-220, 1979, and days 320-75 of 1980-1981. Daily density data from one daytime interval (days 250-365 of 1992) was obtained from POD of the Magellan satellite. Earth: Drag analyses of the following 6 satellites, covering all of the above periods: AIAA/AAS Astrodynamics Specialist Conference, 21 - 24 Aug 2006, Keystone Resort & Conference Center, Keystone, Colorado
Methodology In order to compare relative responses, density variations are converted to equivalent temperature variations using empirical models of each thermosphere: DTM-Mars, Hedin (1983) Venus Model, and J70. Phasing varies from cycle to cycle so that it is difficult to find a single linear coefficient that simply relates the solar and temperature variations. To circumvent this problem in the interest of obtaining some quantitative results, we considered each positive and negative excursion of temperature (T) and F10.7 (F10.7) as a pair, and calculated the corresponding value of T/F10.7. For this purpose the average of all 6 Earth-orbiting satellites were used to obtain a single data point for each T/F10.7 calculation. DT DF10.7 AIAA/AAS Astrodynamics Specialist Conference, 21 - 24 Aug 2006, Keystone Resort & Conference Center, Keystone, Colorado
AIAA/AAS Astrodynamics Specialist Conference, 21 - 24 Aug 2006, Keystone Resort & Conference Center, Keystone, Colorado
AIAA/AAS Astrodynamics Specialist Conference, 21 - 24 Aug 2006, Keystone Resort & Conference Center, Keystone, Colorado
AIAA/AAS Astrodynamics Specialist Conference, 21 - 24 Aug 2006, Keystone Resort & Conference Center, Keystone, Colorado
AIAA/AAS Astrodynamics Specialist Conference, 21 - 24 Aug 2006, Keystone Resort & Conference Center, Keystone, Colorado
Thermosphere response of Earth, Mars and Venus to changes in solar flux due to the Sun’s rotation. F = change in 10.7 cm solar radio flux (F10.7) received at the planet; T = change in exospheric temperature (K). AIAA/AAS Astrodynamics Specialist Conference, 21 - 24 Aug 2006, Keystone Resort & Conference Center, Keystone, Colorado
Conclusions concerning the thermosphere responses of Earth, Mars and Venus to quasi-27-day variations in solar flux due to rotation of the Sun • Mars’s thermosphere response is approximately 1/3rd that of Earth. • Venus’s response is barely discernible, approximately 1/10th that of Earth. • The above differences are likely due to the differing efficiencies of CO2 cooling • in these upper atmospheres. Our results can therefore be used to constrain • planetary atmosphere models that seek to self-consistently and inter-consistently • simulate the thermospheres of these planets. • Our tabulated data might be used for that purpose. However, additional insight • might be gained by attempting to model the actual experimental data, as this • better retains the value of contemporaneity. In particular, different effective local • times and latitudes correspond to each illustrated data set, and numerical • models attempting to emulate these results may need to similarly sample the • model output to optimize the fidelity of the comparison. AIAA/AAS Astrodynamics Specialist Conference, 21 - 24 Aug 2006, Keystone Resort & Conference Center, Keystone, Colorado
The results presented here should prove valuable in validating and/or updating • the parameterization of short-term solar flux variations in empirical models of • Earth’s, Mars’, and Venus’ thermospheres, especially for the purposes of • specifying or predicting atmospheric drag on satellites. Future Work • The effects of long-term solar flux changes on the thermospheres of these • planets, using expanded data sets, i.e., MGS, Odyssey, MRO, Magellan, Venus • Express, etc.. • Improved proxies for EUV solar variability effects, such as E10.7, MgII, • Soho EUV, etc. • Incorporation into DTM-Mars AIAA/AAS Astrodynamics Specialist Conference, 21 - 24 Aug 2006, Keystone Resort & Conference Center, Keystone, Colorado
Average Temperature Profiles for Earth, Mars & Venus Venus Mars Earth CO2 Cooling O + CO2 --> O + CO2* CO2* --> IR emission AIAA/AAS Astrodynamics Specialist Conference, 21 - 24 Aug 2006, Keystone Resort & Conference Center, Keystone, Colorado